Immigrants from Haiti vs Basque Master's Degree
COMPARE
Immigrants from Haiti
Basque
Master's Degree
Master's Degree Comparison
Immigrants from Haiti
Basques
11.8%
MASTER'S DEGREE
0.1/ 100
METRIC RATING
287th/ 347
METRIC RANK
14.7%
MASTER'S DEGREE
36.5/ 100
METRIC RATING
187th/ 347
METRIC RANK
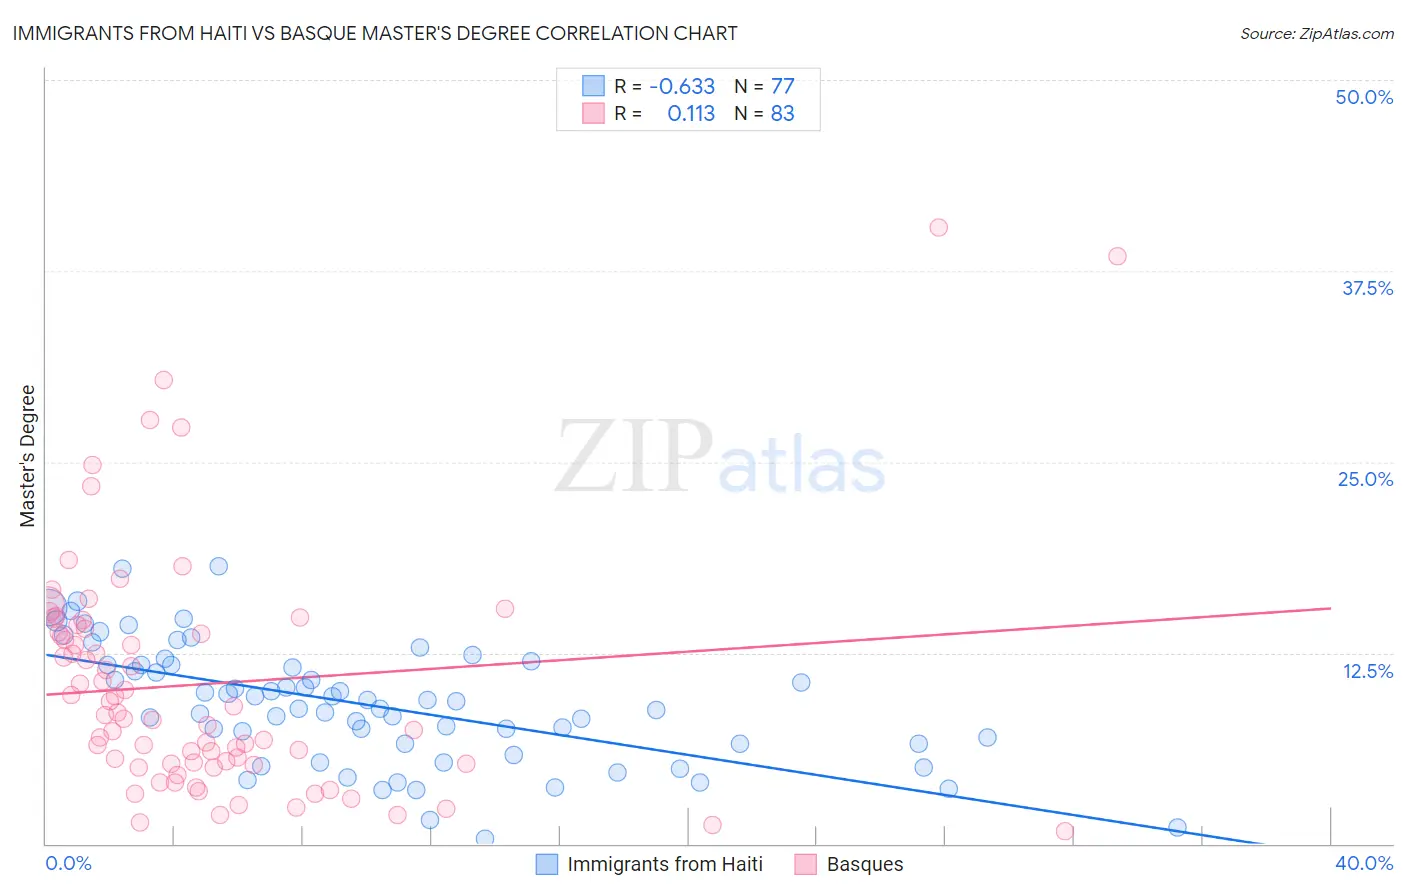
Immigrants from Haiti vs Basque Master's Degree Correlation Chart
The statistical analysis conducted on geographies consisting of 225,216,458 people shows a significant negative correlation between the proportion of Immigrants from Haiti and percentage of population with at least master's degree education in the United States with a correlation coefficient (R) of -0.633 and weighted average of 11.8%. Similarly, the statistical analysis conducted on geographies consisting of 165,765,652 people shows a poor positive correlation between the proportion of Basques and percentage of population with at least master's degree education in the United States with a correlation coefficient (R) of 0.113 and weighted average of 14.7%, a difference of 24.5%.
Master's Degree Correlation Summary
| Measurement | Immigrants from Haiti | Basque |
| Minimum | 0.34% | 0.80% |
| Maximum | 18.2% | 40.4% |
| Range | 17.8% | 39.6% |
| Mean | 9.1% | 10.5% |
| Median | 9.3% | 8.4% |
| Interquartile 25% (IQ1) | 6.5% | 5.2% |
| Interquartile 75% (IQ3) | 11.7% | 14.1% |
| Interquartile Range (IQR) | 5.2% | 8.9% |
| Standard Deviation (Sample) | 3.9% | 7.8% |
| Standard Deviation (Population) | 3.9% | 7.8% |
Similar Demographics by Master's Degree
Demographics Similar to Immigrants from Haiti by Master's Degree
In terms of master's degree, the demographic groups most similar to Immigrants from Haiti are Immigrants from Honduras (11.8%, a difference of 0.17%), Aleut (11.8%, a difference of 0.20%), Guatemalan (11.7%, a difference of 0.25%), Ute (11.7%, a difference of 0.49%), and Immigrants from Nicaragua (11.8%, a difference of 0.55%).
| Demographics | Rating | Rank | Master's Degree |
| Immigrants | Dominican Republic | 0.2 /100 | #280 | Tragic 12.1% |
| Malaysians | 0.2 /100 | #281 | Tragic 12.0% |
| Immigrants | El Salvador | 0.2 /100 | #282 | Tragic 12.0% |
| Hondurans | 0.2 /100 | #283 | Tragic 11.9% |
| Ottawa | 0.2 /100 | #284 | Tragic 11.9% |
| Immigrants | Nicaragua | 0.2 /100 | #285 | Tragic 11.8% |
| Aleuts | 0.1 /100 | #286 | Tragic 11.8% |
| Immigrants | Haiti | 0.1 /100 | #287 | Tragic 11.8% |
| Immigrants | Honduras | 0.1 /100 | #288 | Tragic 11.8% |
| Guatemalans | 0.1 /100 | #289 | Tragic 11.7% |
| Ute | 0.1 /100 | #290 | Tragic 11.7% |
| Colville | 0.1 /100 | #291 | Tragic 11.6% |
| Immigrants | Guatemala | 0.1 /100 | #292 | Tragic 11.6% |
| Alaska Natives | 0.1 /100 | #293 | Tragic 11.6% |
| Hawaiians | 0.1 /100 | #294 | Tragic 11.6% |
Demographics Similar to Basques by Master's Degree
In terms of master's degree, the demographic groups most similar to Basques are Immigrants from Costa Rica (14.7%, a difference of 0.040%), Immigrants from Oceania (14.7%, a difference of 0.080%), Immigrants (14.6%, a difference of 0.080%), Spaniard (14.6%, a difference of 0.10%), and Barbadian (14.7%, a difference of 0.24%).
| Demographics | Rating | Rank | Master's Degree |
| Celtics | 41.3 /100 | #180 | Average 14.8% |
| Swiss | 41.1 /100 | #181 | Average 14.7% |
| Czechs | 40.4 /100 | #182 | Average 14.7% |
| Sri Lankans | 39.6 /100 | #183 | Fair 14.7% |
| Immigrants | Zaire | 39.5 /100 | #184 | Fair 14.7% |
| Barbadians | 38.3 /100 | #185 | Fair 14.7% |
| Immigrants | Oceania | 37.1 /100 | #186 | Fair 14.7% |
| Basques | 36.5 /100 | #187 | Fair 14.7% |
| Immigrants | Costa Rica | 36.2 /100 | #188 | Fair 14.7% |
| Immigrants | Immigrants | 36.0 /100 | #189 | Fair 14.6% |
| Spaniards | 35.8 /100 | #190 | Fair 14.6% |
| Welsh | 34.2 /100 | #191 | Fair 14.6% |
| Immigrants | Middle Africa | 33.6 /100 | #192 | Fair 14.6% |
| Immigrants | Nigeria | 32.7 /100 | #193 | Fair 14.6% |
| Chinese | 32.5 /100 | #194 | Fair 14.6% |