Cree vs Immigrants from Japan Associate's Degree
COMPARE
Cree
Immigrants from Japan
Associate's Degree
Associate's Degree Comparison
Cree
Immigrants from Japan
42.5%
ASSOCIATE'S DEGREE
1.2/ 100
METRIC RATING
240th/ 347
METRIC RANK
54.6%
ASSOCIATE'S DEGREE
100.0/ 100
METRIC RATING
22nd/ 347
METRIC RANK
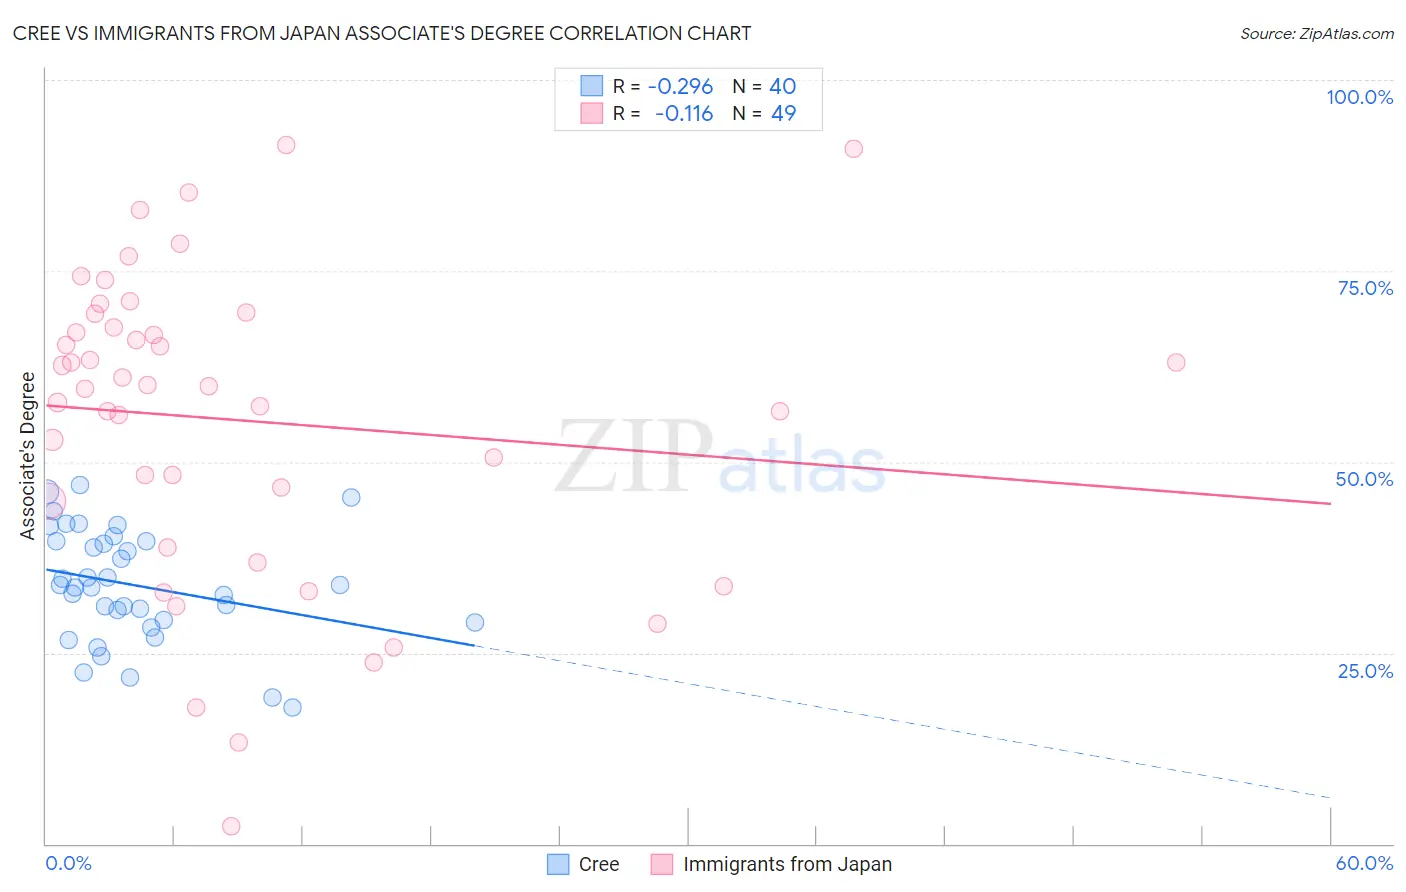
Cree vs Immigrants from Japan Associate's Degree Correlation Chart
The statistical analysis conducted on geographies consisting of 76,211,414 people shows a weak negative correlation between the proportion of Cree and percentage of population with at least associate's degree education in the United States with a correlation coefficient (R) of -0.296 and weighted average of 42.5%. Similarly, the statistical analysis conducted on geographies consisting of 340,131,347 people shows a poor negative correlation between the proportion of Immigrants from Japan and percentage of population with at least associate's degree education in the United States with a correlation coefficient (R) of -0.116 and weighted average of 54.6%, a difference of 28.4%.
Associate's Degree Correlation Summary
| Measurement | Cree | Immigrants from Japan |
| Minimum | 17.8% | 2.2% |
| Maximum | 46.9% | 91.6% |
| Range | 29.1% | 89.3% |
| Mean | 33.8% | 55.5% |
| Median | 33.7% | 60.0% |
| Interquartile 25% (IQ1) | 29.1% | 41.7% |
| Interquartile 75% (IQ3) | 39.6% | 68.5% |
| Interquartile Range (IQR) | 10.6% | 26.8% |
| Standard Deviation (Sample) | 7.4% | 20.1% |
| Standard Deviation (Population) | 7.3% | 19.9% |
Similar Demographics by Associate's Degree
Demographics Similar to Cree by Associate's Degree
In terms of associate's degree, the demographic groups most similar to Cree are Immigrants from Grenada (42.6%, a difference of 0.18%), British West Indian (42.4%, a difference of 0.33%), Immigrants from West Indies (42.4%, a difference of 0.34%), Guyanese (42.3%, a difference of 0.45%), and Immigrants from Liberia (42.3%, a difference of 0.59%).
| Demographics | Rating | Rank | Associate's Degree |
| Tongans | 2.2 /100 | #233 | Tragic 43.0% |
| Tlingit-Haida | 2.1 /100 | #234 | Tragic 43.0% |
| Ecuadorians | 2.0 /100 | #235 | Tragic 43.0% |
| Immigrants | St. Vincent and the Grenadines | 1.9 /100 | #236 | Tragic 42.9% |
| Immigrants | Nonimmigrants | 1.9 /100 | #237 | Tragic 42.9% |
| Iroquois | 1.7 /100 | #238 | Tragic 42.8% |
| Immigrants | Grenada | 1.3 /100 | #239 | Tragic 42.6% |
| Cree | 1.2 /100 | #240 | Tragic 42.5% |
| British West Indians | 1.0 /100 | #241 | Tragic 42.4% |
| Immigrants | West Indies | 1.0 /100 | #242 | Tragic 42.4% |
| Guyanese | 1.0 /100 | #243 | Tragic 42.3% |
| Immigrants | Liberia | 0.9 /100 | #244 | Tragic 42.3% |
| Immigrants | Cambodia | 0.9 /100 | #245 | Tragic 42.3% |
| Delaware | 0.9 /100 | #246 | Tragic 42.3% |
| Immigrants | Fiji | 0.8 /100 | #247 | Tragic 42.2% |
Demographics Similar to Immigrants from Japan by Associate's Degree
In terms of associate's degree, the demographic groups most similar to Immigrants from Japan are Burmese (54.6%, a difference of 0.0%), Immigrants from Sweden (54.6%, a difference of 0.030%), Immigrants from Korea (54.5%, a difference of 0.090%), Cambodian (54.6%, a difference of 0.10%), and Immigrants from Ireland (54.7%, a difference of 0.12%).
| Demographics | Rating | Rank | Associate's Degree |
| Immigrants | Eastern Asia | 100.0 /100 | #15 | Exceptional 55.4% |
| Soviet Union | 100.0 /100 | #16 | Exceptional 55.1% |
| Eastern Europeans | 100.0 /100 | #17 | Exceptional 55.0% |
| Indians (Asian) | 100.0 /100 | #18 | Exceptional 54.8% |
| Immigrants | Ireland | 100.0 /100 | #19 | Exceptional 54.7% |
| Cambodians | 100.0 /100 | #20 | Exceptional 54.6% |
| Immigrants | Sweden | 100.0 /100 | #21 | Exceptional 54.6% |
| Immigrants | Japan | 100.0 /100 | #22 | Exceptional 54.6% |
| Burmese | 100.0 /100 | #23 | Exceptional 54.6% |
| Immigrants | Korea | 100.0 /100 | #24 | Exceptional 54.5% |
| Immigrants | Switzerland | 100.0 /100 | #25 | Exceptional 54.5% |
| Immigrants | Belgium | 100.0 /100 | #26 | Exceptional 54.5% |
| Latvians | 100.0 /100 | #27 | Exceptional 53.9% |
| Turks | 100.0 /100 | #28 | Exceptional 53.9% |
| Immigrants | France | 100.0 /100 | #29 | Exceptional 53.9% |