Immigrants from North America vs Immigrants from Cambodia Doctorate Degree
COMPARE
Immigrants from North America
Immigrants from Cambodia
Doctorate Degree
Doctorate Degree Comparison
Immigrants from North America
Immigrants from Cambodia
2.2%
DOCTORATE DEGREE
99.8/ 100
METRIC RATING
74th/ 347
METRIC RANK
1.5%
DOCTORATE DEGREE
1.0/ 100
METRIC RATING
254th/ 347
METRIC RANK
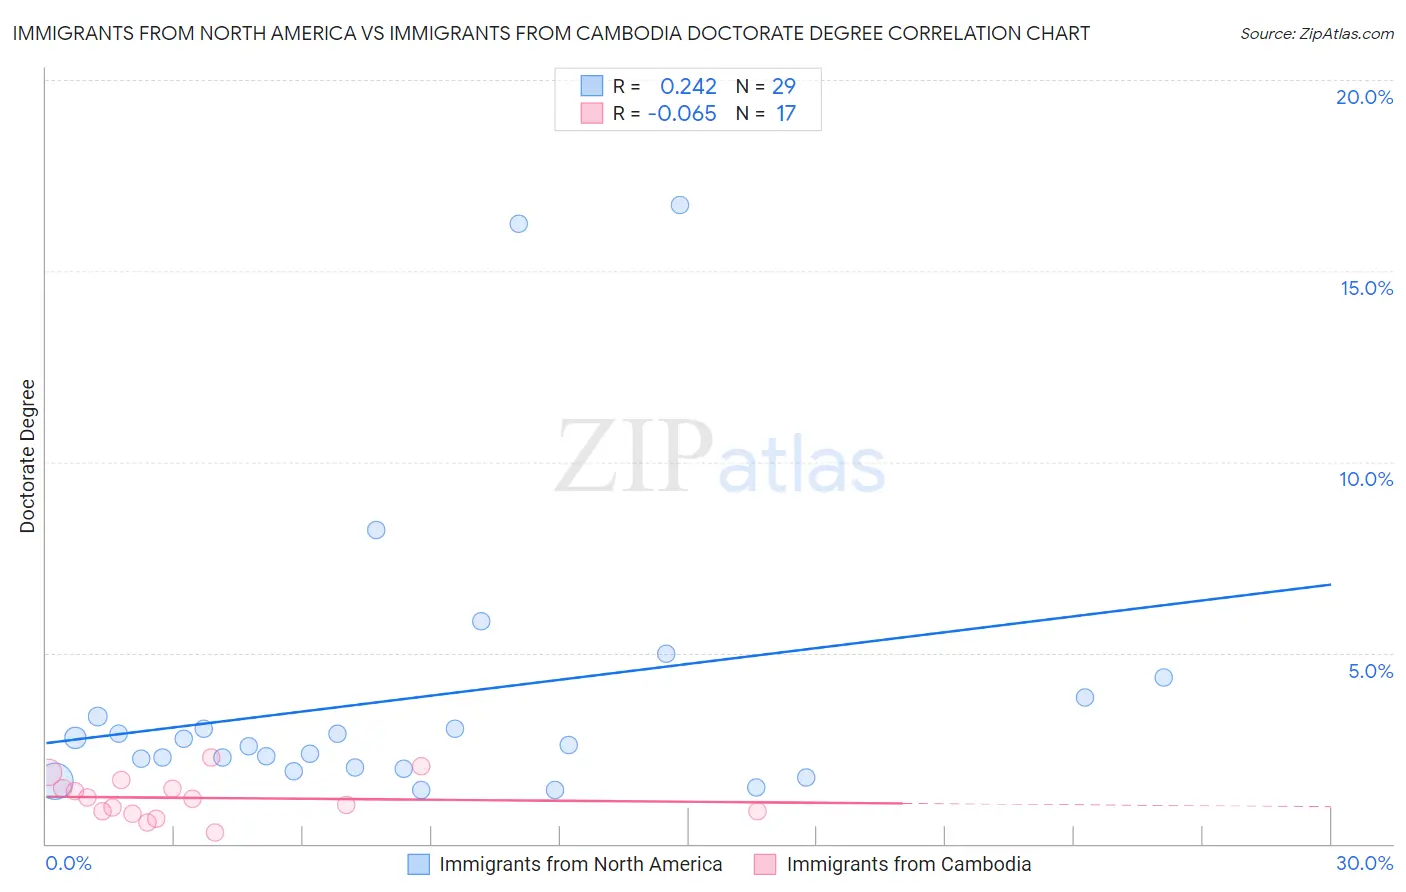
Immigrants from North America vs Immigrants from Cambodia Doctorate Degree Correlation Chart
The statistical analysis conducted on geographies consisting of 455,963,047 people shows a weak positive correlation between the proportion of Immigrants from North America and percentage of population with at least doctorate degree education in the United States with a correlation coefficient (R) of 0.242 and weighted average of 2.2%. Similarly, the statistical analysis conducted on geographies consisting of 204,355,186 people shows a slight negative correlation between the proportion of Immigrants from Cambodia and percentage of population with at least doctorate degree education in the United States with a correlation coefficient (R) of -0.065 and weighted average of 1.5%, a difference of 47.2%.
Doctorate Degree Correlation Summary
| Measurement | Immigrants from North America | Immigrants from Cambodia |
| Minimum | 1.4% | 0.29% |
| Maximum | 16.7% | 2.3% |
| Range | 15.3% | 2.0% |
| Mean | 3.8% | 1.2% |
| Median | 2.6% | 1.2% |
| Interquartile 25% (IQ1) | 2.0% | 0.82% |
| Interquartile 75% (IQ3) | 3.6% | 1.6% |
| Interquartile Range (IQR) | 1.6% | 0.74% |
| Standard Deviation (Sample) | 3.8% | 0.54% |
| Standard Deviation (Population) | 3.7% | 0.53% |
Similar Demographics by Doctorate Degree
Demographics Similar to Immigrants from North America by Doctorate Degree
In terms of doctorate degree, the demographic groups most similar to Immigrants from North America are Immigrants from Western Asia (2.2%, a difference of 0.10%), Immigrants from Bulgaria (2.3%, a difference of 0.14%), Immigrants from Hungary (2.2%, a difference of 0.18%), Immigrants from Lebanon (2.2%, a difference of 0.18%), and Immigrants from Canada (2.3%, a difference of 0.22%).
| Demographics | Rating | Rank | Doctorate Degree |
| Zimbabweans | 99.8 /100 | #67 | Exceptional 2.3% |
| Immigrants | Kazakhstan | 99.8 /100 | #68 | Exceptional 2.3% |
| Carpatho Rusyns | 99.8 /100 | #69 | Exceptional 2.3% |
| Lithuanians | 99.8 /100 | #70 | Exceptional 2.3% |
| Immigrants | Bolivia | 99.8 /100 | #71 | Exceptional 2.3% |
| Immigrants | Canada | 99.8 /100 | #72 | Exceptional 2.3% |
| Immigrants | Bulgaria | 99.8 /100 | #73 | Exceptional 2.3% |
| Immigrants | North America | 99.8 /100 | #74 | Exceptional 2.2% |
| Immigrants | Western Asia | 99.8 /100 | #75 | Exceptional 2.2% |
| Immigrants | Hungary | 99.8 /100 | #76 | Exceptional 2.2% |
| Immigrants | Lebanon | 99.8 /100 | #77 | Exceptional 2.2% |
| Immigrants | Belarus | 99.7 /100 | #78 | Exceptional 2.2% |
| Northern Europeans | 99.7 /100 | #79 | Exceptional 2.2% |
| Ugandans | 99.7 /100 | #80 | Exceptional 2.2% |
| Immigrants | Argentina | 99.7 /100 | #81 | Exceptional 2.2% |
Demographics Similar to Immigrants from Cambodia by Doctorate Degree
In terms of doctorate degree, the demographic groups most similar to Immigrants from Cambodia are Trinidadian and Tobagonian (1.5%, a difference of 0.010%), Central American Indian (1.5%, a difference of 0.050%), American (1.5%, a difference of 0.13%), Chippewa (1.5%, a difference of 0.27%), and Yuman (1.5%, a difference of 0.28%).
| Demographics | Rating | Rank | Doctorate Degree |
| Comanche | 1.8 /100 | #247 | Tragic 1.6% |
| Africans | 1.8 /100 | #248 | Tragic 1.6% |
| Potawatomi | 1.6 /100 | #249 | Tragic 1.6% |
| Immigrants | Fiji | 1.6 /100 | #250 | Tragic 1.6% |
| Apache | 1.3 /100 | #251 | Tragic 1.5% |
| Yuman | 1.1 /100 | #252 | Tragic 1.5% |
| Americans | 1.0 /100 | #253 | Tragic 1.5% |
| Immigrants | Cambodia | 1.0 /100 | #254 | Tragic 1.5% |
| Trinidadians and Tobagonians | 1.0 /100 | #255 | Tragic 1.5% |
| Central American Indians | 1.0 /100 | #256 | Tragic 1.5% |
| Chippewa | 0.9 /100 | #257 | Tragic 1.5% |
| Immigrants | West Indies | 0.9 /100 | #258 | Tragic 1.5% |
| Liberians | 0.9 /100 | #259 | Tragic 1.5% |
| Japanese | 0.9 /100 | #260 | Tragic 1.5% |
| Immigrants | Portugal | 0.8 /100 | #261 | Tragic 1.5% |