Panamanian vs American High School Diploma
COMPARE
Panamanian
American
High School Diploma
High School Diploma Comparison
Panamanians
Americans
88.6%
HIGH SCHOOL DIPLOMA
18.0/ 100
METRIC RATING
202nd/ 347
METRIC RANK
89.1%
HIGH SCHOOL DIPLOMA
47.2/ 100
METRIC RATING
179th/ 347
METRIC RANK
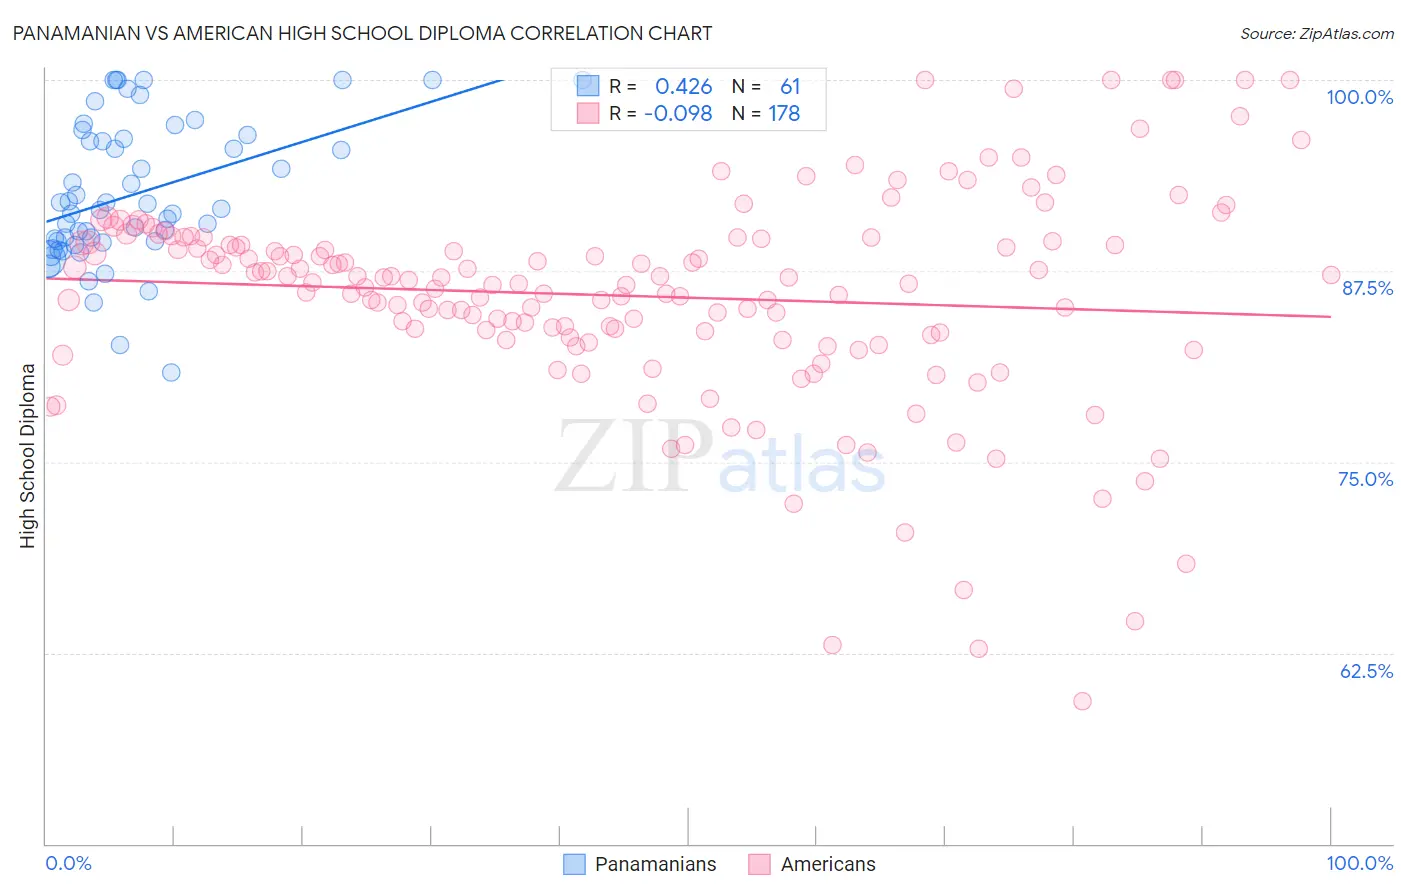
Panamanian vs American High School Diploma Correlation Chart
The statistical analysis conducted on geographies consisting of 281,248,649 people shows a moderate positive correlation between the proportion of Panamanians and percentage of population with at least high school diploma education in the United States with a correlation coefficient (R) of 0.426 and weighted average of 88.6%. Similarly, the statistical analysis conducted on geographies consisting of 581,993,169 people shows a slight negative correlation between the proportion of Americans and percentage of population with at least high school diploma education in the United States with a correlation coefficient (R) of -0.098 and weighted average of 89.1%, a difference of 0.53%.
High School Diploma Correlation Summary
| Measurement | Panamanian | American |
| Minimum | 80.9% | 59.3% |
| Maximum | 100.0% | 100.0% |
| Range | 19.1% | 40.7% |
| Mean | 92.6% | 85.9% |
| Median | 91.5% | 86.8% |
| Interquartile 25% (IQ1) | 89.4% | 83.3% |
| Interquartile 75% (IQ3) | 96.2% | 89.4% |
| Interquartile Range (IQR) | 6.8% | 6.1% |
| Standard Deviation (Sample) | 4.6% | 6.9% |
| Standard Deviation (Population) | 4.6% | 6.9% |
Similar Demographics by High School Diploma
Demographics Similar to Panamanians by High School Diploma
In terms of high school diploma, the demographic groups most similar to Panamanians are Korean (88.6%, a difference of 0.0%), Hawaiian (88.6%, a difference of 0.010%), Somali (88.6%, a difference of 0.010%), Liberian (88.7%, a difference of 0.020%), and Marshallese (88.6%, a difference of 0.020%).
| Demographics | Rating | Rank | High School Diploma |
| Afghans | 23.9 /100 | #195 | Fair 88.8% |
| Immigrants | Southern Europe | 23.4 /100 | #196 | Fair 88.7% |
| French American Indians | 21.5 /100 | #197 | Fair 88.7% |
| Liberians | 18.8 /100 | #198 | Poor 88.7% |
| Marshallese | 18.7 /100 | #199 | Poor 88.6% |
| Hawaiians | 18.3 /100 | #200 | Poor 88.6% |
| Koreans | 18.1 /100 | #201 | Poor 88.6% |
| Panamanians | 18.0 /100 | #202 | Poor 88.6% |
| Somalis | 17.5 /100 | #203 | Poor 88.6% |
| Armenians | 17.2 /100 | #204 | Poor 88.6% |
| Immigrants | Micronesia | 16.4 /100 | #205 | Poor 88.6% |
| Arapaho | 16.1 /100 | #206 | Poor 88.6% |
| Immigrants | Sierra Leone | 15.8 /100 | #207 | Poor 88.6% |
| Portuguese | 14.4 /100 | #208 | Poor 88.5% |
| Cherokee | 14.3 /100 | #209 | Poor 88.5% |
Demographics Similar to Americans by High School Diploma
In terms of high school diploma, the demographic groups most similar to Americans are Osage (89.1%, a difference of 0.020%), Sudanese (89.1%, a difference of 0.020%), Sierra Leonean (89.1%, a difference of 0.020%), Immigrants from Western Asia (89.1%, a difference of 0.030%), and Bolivian (89.1%, a difference of 0.030%).
| Demographics | Rating | Rank | High School Diploma |
| Immigrants | Nonimmigrants | 51.8 /100 | #172 | Average 89.2% |
| Immigrants | Indonesia | 50.3 /100 | #173 | Average 89.1% |
| Hmong | 50.0 /100 | #174 | Average 89.1% |
| Immigrants | Western Asia | 49.0 /100 | #175 | Average 89.1% |
| Osage | 48.9 /100 | #176 | Average 89.1% |
| Sudanese | 48.5 /100 | #177 | Average 89.1% |
| Sierra Leoneans | 48.4 /100 | #178 | Average 89.1% |
| Americans | 47.2 /100 | #179 | Average 89.1% |
| Bolivians | 45.2 /100 | #180 | Average 89.1% |
| Venezuelans | 43.6 /100 | #181 | Average 89.1% |
| Spaniards | 43.4 /100 | #182 | Average 89.1% |
| Potawatomi | 42.5 /100 | #183 | Average 89.0% |
| Immigrants | Syria | 39.2 /100 | #184 | Fair 89.0% |
| Ethiopians | 37.0 /100 | #185 | Fair 89.0% |
| Immigrants | Eastern Africa | 35.8 /100 | #186 | Fair 88.9% |