Costa Rican vs Cajun Associate's Degree
COMPARE
Costa Rican
Cajun
Associate's Degree
Associate's Degree Comparison
Costa Ricans
Cajuns
46.0%
ASSOCIATE'S DEGREE
38.6/ 100
METRIC RATING
185th/ 347
METRIC RANK
37.4%
ASSOCIATE'S DEGREE
0.0/ 100
METRIC RATING
320th/ 347
METRIC RANK
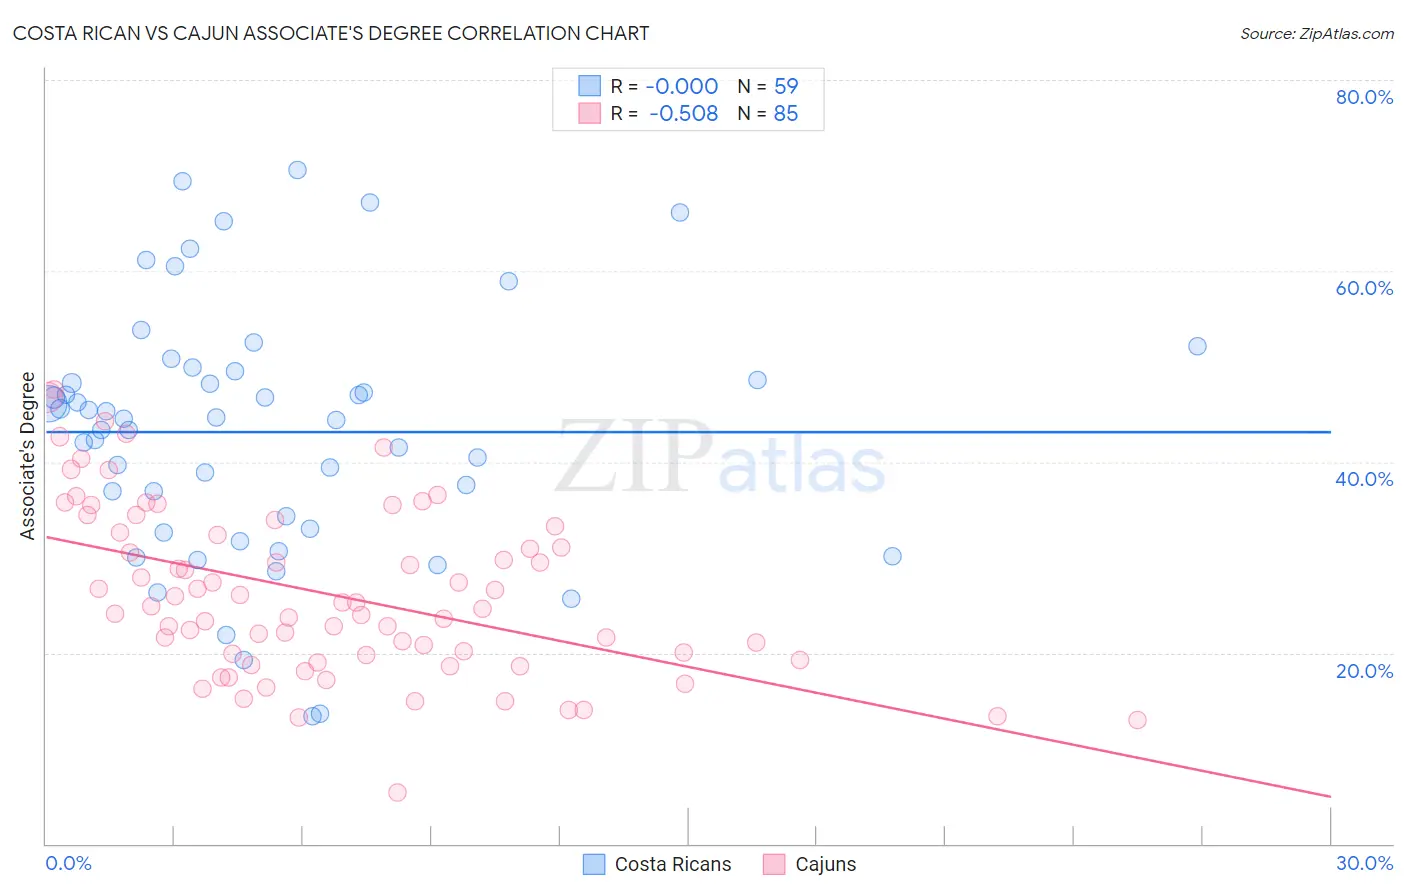
Costa Rican vs Cajun Associate's Degree Correlation Chart
The statistical analysis conducted on geographies consisting of 253,596,799 people shows no correlation between the proportion of Costa Ricans and percentage of population with at least associate's degree education in the United States with a correlation coefficient (R) of -0.000 and weighted average of 46.0%. Similarly, the statistical analysis conducted on geographies consisting of 149,710,978 people shows a substantial negative correlation between the proportion of Cajuns and percentage of population with at least associate's degree education in the United States with a correlation coefficient (R) of -0.508 and weighted average of 37.4%, a difference of 23.0%.
Associate's Degree Correlation Summary
| Measurement | Costa Rican | Cajun |
| Minimum | 13.4% | 5.4% |
| Maximum | 70.5% | 47.6% |
| Range | 57.2% | 42.2% |
| Mean | 43.1% | 26.2% |
| Median | 44.5% | 24.9% |
| Interquartile 25% (IQ1) | 33.0% | 19.5% |
| Interquartile 75% (IQ3) | 49.5% | 32.9% |
| Interquartile Range (IQR) | 16.5% | 13.4% |
| Standard Deviation (Sample) | 13.1% | 8.9% |
| Standard Deviation (Population) | 13.0% | 8.8% |
Similar Demographics by Associate's Degree
Demographics Similar to Costa Ricans by Associate's Degree
In terms of associate's degree, the demographic groups most similar to Costa Ricans are Welsh (45.9%, a difference of 0.060%), Czechoslovakian (46.0%, a difference of 0.11%), Yugoslavian (46.0%, a difference of 0.13%), Swiss (46.0%, a difference of 0.14%), and Immigrants from Colombia (46.0%, a difference of 0.21%).
| Demographics | Rating | Rank | Associate's Degree |
| Immigrants | Bosnia and Herzegovina | 48.3 /100 | #178 | Average 46.3% |
| Sri Lankans | 47.6 /100 | #179 | Average 46.3% |
| Bermudans | 46.4 /100 | #180 | Average 46.2% |
| Immigrants | Colombia | 41.3 /100 | #181 | Average 46.0% |
| Swiss | 40.4 /100 | #182 | Average 46.0% |
| Yugoslavians | 40.2 /100 | #183 | Average 46.0% |
| Czechoslovakians | 40.0 /100 | #184 | Average 46.0% |
| Costa Ricans | 38.6 /100 | #185 | Fair 46.0% |
| Welsh | 37.9 /100 | #186 | Fair 45.9% |
| Immigrants | Uruguay | 35.5 /100 | #187 | Fair 45.8% |
| Ghanaians | 35.5 /100 | #188 | Fair 45.8% |
| Immigrants | Oceania | 34.7 /100 | #189 | Fair 45.8% |
| Vietnamese | 34.0 /100 | #190 | Fair 45.8% |
| Koreans | 33.8 /100 | #191 | Fair 45.8% |
| Celtics | 33.3 /100 | #192 | Fair 45.8% |
Demographics Similar to Cajuns by Associate's Degree
In terms of associate's degree, the demographic groups most similar to Cajuns are Fijian (37.4%, a difference of 0.030%), Immigrants from Yemen (37.3%, a difference of 0.12%), Alaska Native (37.5%, a difference of 0.25%), Pennsylvania German (37.2%, a difference of 0.40%), and Yaqui (37.6%, a difference of 0.48%).
| Demographics | Rating | Rank | Associate's Degree |
| Hispanics or Latinos | 0.0 /100 | #313 | Tragic 37.7% |
| Seminole | 0.0 /100 | #314 | Tragic 37.7% |
| Creek | 0.0 /100 | #315 | Tragic 37.6% |
| Crow | 0.0 /100 | #316 | Tragic 37.6% |
| Yaqui | 0.0 /100 | #317 | Tragic 37.6% |
| Alaska Natives | 0.0 /100 | #318 | Tragic 37.5% |
| Fijians | 0.0 /100 | #319 | Tragic 37.4% |
| Cajuns | 0.0 /100 | #320 | Tragic 37.4% |
| Immigrants | Yemen | 0.0 /100 | #321 | Tragic 37.3% |
| Pennsylvania Germans | 0.0 /100 | #322 | Tragic 37.2% |
| Immigrants | Cabo Verde | 0.0 /100 | #323 | Tragic 36.8% |
| Arapaho | 0.0 /100 | #324 | Tragic 36.7% |
| Menominee | 0.0 /100 | #325 | Tragic 36.7% |
| Kiowa | 0.0 /100 | #326 | Tragic 36.5% |
| Dutch West Indians | 0.0 /100 | #327 | Tragic 36.5% |