Costa Rican vs Black/African American Receiving Food Stamps
COMPARE
Costa Rican
Black/African American
Receiving Food Stamps
Receiving Food Stamps Comparison
Costa Ricans
Blacks/African Americans
11.6%
RECEIVING FOOD STAMPS
57.9/ 100
METRIC RATING
170th/ 347
METRIC RANK
17.2%
RECEIVING FOOD STAMPS
0.0/ 100
METRIC RATING
317th/ 347
METRIC RANK
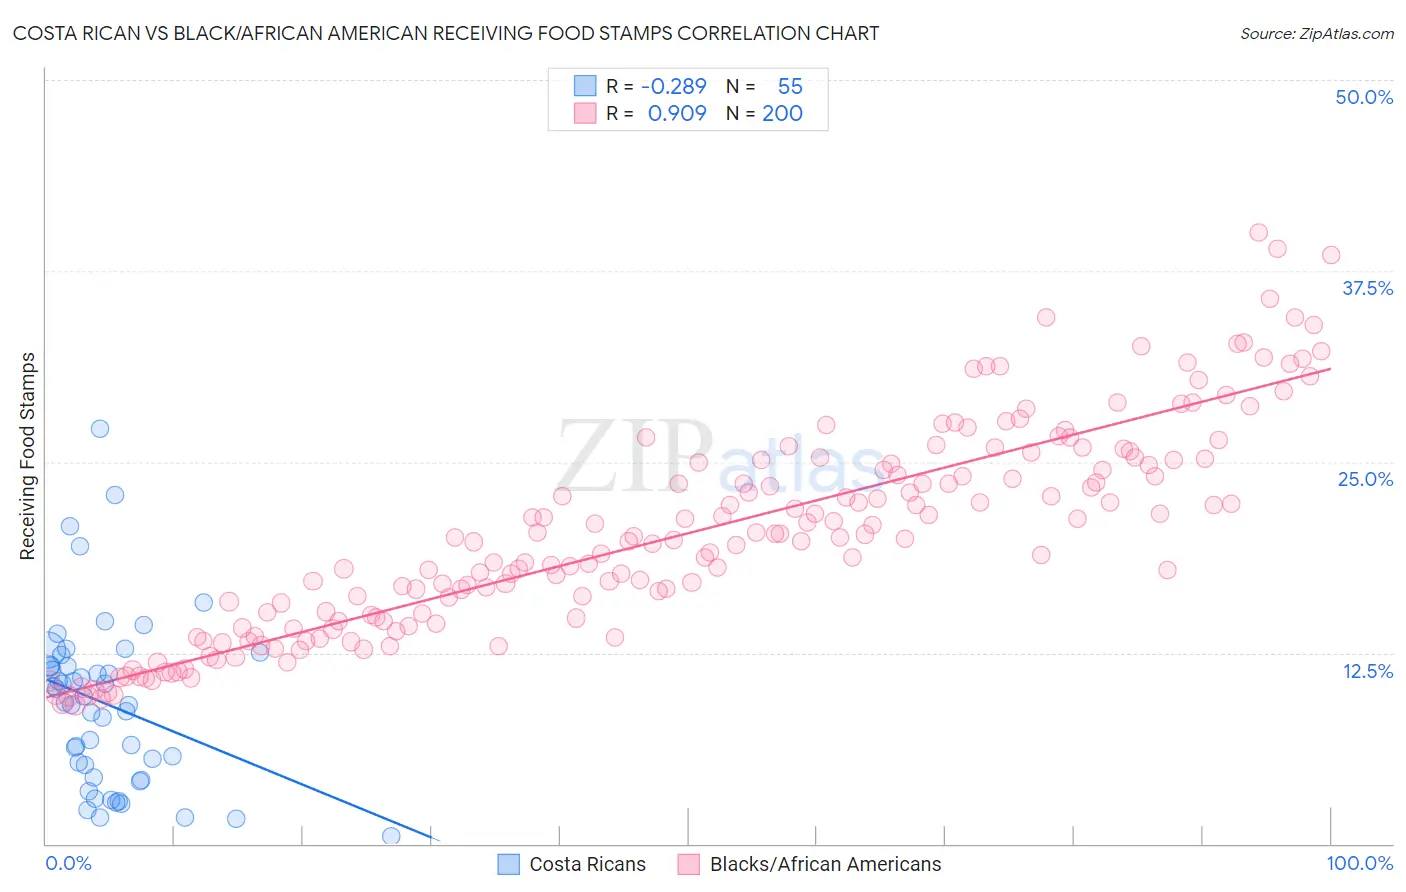
Costa Rican vs Black/African American Receiving Food Stamps Correlation Chart
The statistical analysis conducted on geographies consisting of 253,245,206 people shows a weak negative correlation between the proportion of Costa Ricans and percentage of population receiving government assistance and/or food stamps in the United States with a correlation coefficient (R) of -0.289 and weighted average of 11.6%. Similarly, the statistical analysis conducted on geographies consisting of 562,963,519 people shows a near-perfect positive correlation between the proportion of Blacks/African Americans and percentage of population receiving government assistance and/or food stamps in the United States with a correlation coefficient (R) of 0.909 and weighted average of 17.2%, a difference of 47.9%.
Receiving Food Stamps Correlation Summary
| Measurement | Costa Rican | Black/African American |
| Minimum | 0.50% | 9.1% |
| Maximum | 27.2% | 40.0% |
| Range | 26.7% | 31.0% |
| Mean | 9.1% | 20.3% |
| Median | 9.3% | 20.0% |
| Interquartile 25% (IQ1) | 4.3% | 14.7% |
| Interquartile 75% (IQ3) | 11.7% | 25.0% |
| Interquartile Range (IQR) | 7.4% | 10.3% |
| Standard Deviation (Sample) | 5.6% | 6.8% |
| Standard Deviation (Population) | 5.5% | 6.8% |
Similar Demographics by Receiving Food Stamps
Demographics Similar to Costa Ricans by Receiving Food Stamps
In terms of receiving food stamps, the demographic groups most similar to Costa Ricans are Immigrants from Eastern Africa (11.6%, a difference of 0.060%), Tlingit-Haida (11.6%, a difference of 0.18%), Immigrants from Western Asia (11.6%, a difference of 0.22%), Kenyan (11.6%, a difference of 0.35%), and Guamanian/Chamorro (11.7%, a difference of 0.53%).
| Demographics | Rating | Rank | Receiving Food Stamps |
| Immigrants | Southern Europe | 65.8 /100 | #163 | Good 11.5% |
| Immigrants | Chile | 65.0 /100 | #164 | Good 11.5% |
| Arabs | 64.7 /100 | #165 | Good 11.5% |
| Immigrants | Belarus | 62.8 /100 | #166 | Good 11.5% |
| Kenyans | 60.2 /100 | #167 | Good 11.6% |
| Tlingit-Haida | 59.1 /100 | #168 | Average 11.6% |
| Immigrants | Eastern Africa | 58.3 /100 | #169 | Average 11.6% |
| Costa Ricans | 57.9 /100 | #170 | Average 11.6% |
| Immigrants | Western Asia | 56.4 /100 | #171 | Average 11.6% |
| Guamanians/Chamorros | 54.2 /100 | #172 | Average 11.7% |
| Immigrants | Syria | 53.4 /100 | #173 | Average 11.7% |
| Immigrants | Eritrea | 50.0 /100 | #174 | Average 11.7% |
| Osage | 49.8 /100 | #175 | Average 11.7% |
| Peruvians | 49.3 /100 | #176 | Average 11.7% |
| Immigrants | Ukraine | 48.4 /100 | #177 | Average 11.8% |
Demographics Similar to Blacks/African Americans by Receiving Food Stamps
In terms of receiving food stamps, the demographic groups most similar to Blacks/African Americans are Menominee (17.2%, a difference of 0.17%), Immigrants from St. Vincent and the Grenadines (17.2%, a difference of 0.35%), Immigrants from Nicaragua (17.2%, a difference of 0.43%), Central American Indian (17.1%, a difference of 0.53%), and Native/Alaskan (17.3%, a difference of 0.62%).
| Demographics | Rating | Rank | Receiving Food Stamps |
| Immigrants | Barbados | 0.0 /100 | #310 | Tragic 16.6% |
| Guyanese | 0.0 /100 | #311 | Tragic 16.7% |
| Sioux | 0.0 /100 | #312 | Tragic 16.8% |
| Immigrants | Jamaica | 0.0 /100 | #313 | Tragic 16.9% |
| Immigrants | Guyana | 0.0 /100 | #314 | Tragic 16.9% |
| Bahamians | 0.0 /100 | #315 | Tragic 17.0% |
| Central American Indians | 0.0 /100 | #316 | Tragic 17.1% |
| Blacks/African Americans | 0.0 /100 | #317 | Tragic 17.2% |
| Menominee | 0.0 /100 | #318 | Tragic 17.2% |
| Immigrants | St. Vincent and the Grenadines | 0.0 /100 | #319 | Tragic 17.2% |
| Immigrants | Nicaragua | 0.0 /100 | #320 | Tragic 17.2% |
| Natives/Alaskans | 0.0 /100 | #321 | Tragic 17.3% |
| Immigrants | Grenada | 0.0 /100 | #322 | Tragic 17.8% |
| Haitians | 0.0 /100 | #323 | Tragic 17.8% |
| British West Indians | 0.0 /100 | #324 | Tragic 17.9% |