Comanche vs Trinidadian and Tobagonian 12th Grade, No Diploma
COMPARE
Comanche
Trinidadian and Tobagonian
12th Grade, No Diploma
12th Grade, No Diploma Comparison
Comanche
Trinidadians and Tobagonians
89.9%
12TH GRADE, NO DIPLOMA
1.1/ 100
METRIC RATING
248th/ 347
METRIC RANK
89.4%
12TH GRADE, NO DIPLOMA
0.2/ 100
METRIC RATING
265th/ 347
METRIC RANK
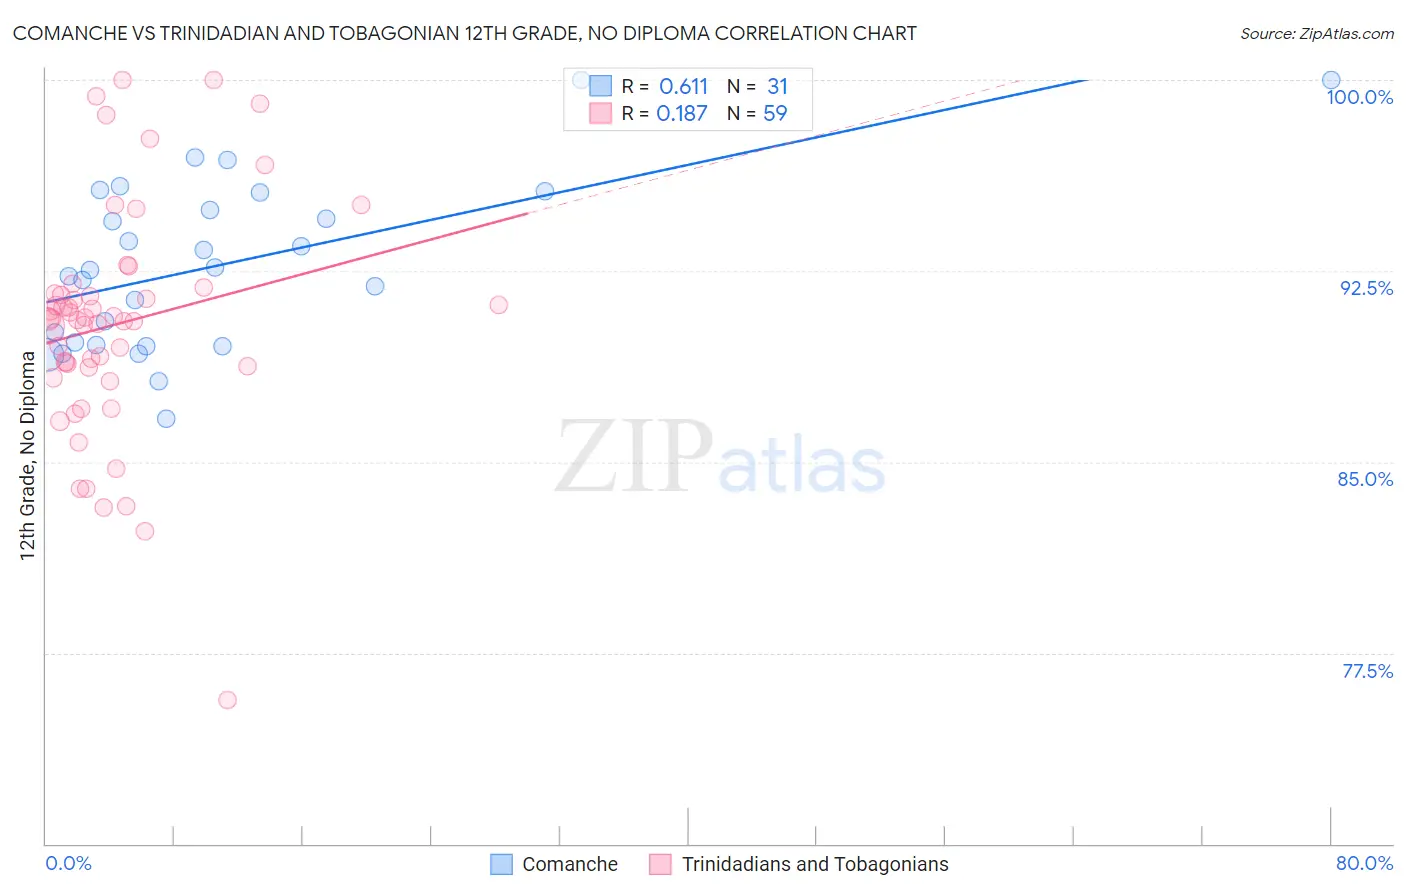
Comanche vs Trinidadian and Tobagonian 12th Grade, No Diploma Correlation Chart
The statistical analysis conducted on geographies consisting of 109,786,530 people shows a significant positive correlation between the proportion of Comanche and percentage of population with at least 12th grade (no diploma) education in the United States with a correlation coefficient (R) of 0.611 and weighted average of 89.9%. Similarly, the statistical analysis conducted on geographies consisting of 219,881,800 people shows a poor positive correlation between the proportion of Trinidadians and Tobagonians and percentage of population with at least 12th grade (no diploma) education in the United States with a correlation coefficient (R) of 0.187 and weighted average of 89.4%, a difference of 0.54%.
12th Grade, No Diploma Correlation Summary
| Measurement | Comanche | Trinidadian and Tobagonian |
| Minimum | 86.7% | 75.6% |
| Maximum | 100.0% | 100.0% |
| Range | 13.3% | 24.4% |
| Mean | 92.7% | 90.4% |
| Median | 92.5% | 90.6% |
| Interquartile 25% (IQ1) | 89.6% | 88.7% |
| Interquartile 75% (IQ3) | 95.6% | 91.6% |
| Interquartile Range (IQR) | 6.0% | 2.9% |
| Standard Deviation (Sample) | 3.4% | 4.5% |
| Standard Deviation (Population) | 3.3% | 4.5% |
Demographics Similar to Comanche and Trinidadians and Tobagonians by 12th Grade, No Diploma
In terms of 12th grade, no diploma, the demographic groups most similar to Comanche are Senegalese (89.9%, a difference of 0.0%), Immigrants from Eritrea (89.9%, a difference of 0.030%), Spanish American (89.9%, a difference of 0.040%), Immigrants from Nigeria (89.9%, a difference of 0.050%), and Bahamian (89.9%, a difference of 0.050%). Similarly, the demographic groups most similar to Trinidadians and Tobagonians are Sri Lankan (89.4%, a difference of 0.010%), Immigrants from Jamaica (89.5%, a difference of 0.060%), Seminole (89.4%, a difference of 0.070%), Cheyenne (89.6%, a difference of 0.20%), and Sioux (89.6%, a difference of 0.20%).
| Demographics | Rating | Rank | 12th Grade, No Diploma |
| Ghanaians | 1.3 /100 | #246 | Tragic 90.0% |
| Immigrants | Nigeria | 1.3 /100 | #247 | Tragic 89.9% |
| Comanche | 1.1 /100 | #248 | Tragic 89.9% |
| Senegalese | 1.1 /100 | #249 | Tragic 89.9% |
| Immigrants | Eritrea | 1.0 /100 | #250 | Tragic 89.9% |
| Spanish Americans | 0.9 /100 | #251 | Tragic 89.9% |
| Bahamians | 0.9 /100 | #252 | Tragic 89.9% |
| Choctaw | 0.7 /100 | #253 | Tragic 89.8% |
| Immigrants | Peru | 0.5 /100 | #254 | Tragic 89.7% |
| Immigrants | Senegal | 0.5 /100 | #255 | Tragic 89.7% |
| Immigrants | Ghana | 0.5 /100 | #256 | Tragic 89.7% |
| Jamaicans | 0.5 /100 | #257 | Tragic 89.7% |
| Africans | 0.4 /100 | #258 | Tragic 89.6% |
| Immigrants | Western Africa | 0.4 /100 | #259 | Tragic 89.6% |
| Immigrants | South Eastern Asia | 0.4 /100 | #260 | Tragic 89.6% |
| Cheyenne | 0.4 /100 | #261 | Tragic 89.6% |
| Sioux | 0.4 /100 | #262 | Tragic 89.6% |
| Immigrants | Jamaica | 0.2 /100 | #263 | Tragic 89.5% |
| Sri Lankans | 0.2 /100 | #264 | Tragic 89.4% |
| Trinidadians and Tobagonians | 0.2 /100 | #265 | Tragic 89.4% |
| Seminole | 0.2 /100 | #266 | Tragic 89.4% |