Irish vs Native/Alaskan 9th Grade
COMPARE
Irish
Native/Alaskan
9th Grade
9th Grade Comparison
Irish
Natives/Alaskans
96.5%
9TH GRADE
100.0/ 100
METRIC RATING
15th/ 347
METRIC RANK
93.9%
9TH GRADE
0.4/ 100
METRIC RATING
265th/ 347
METRIC RANK
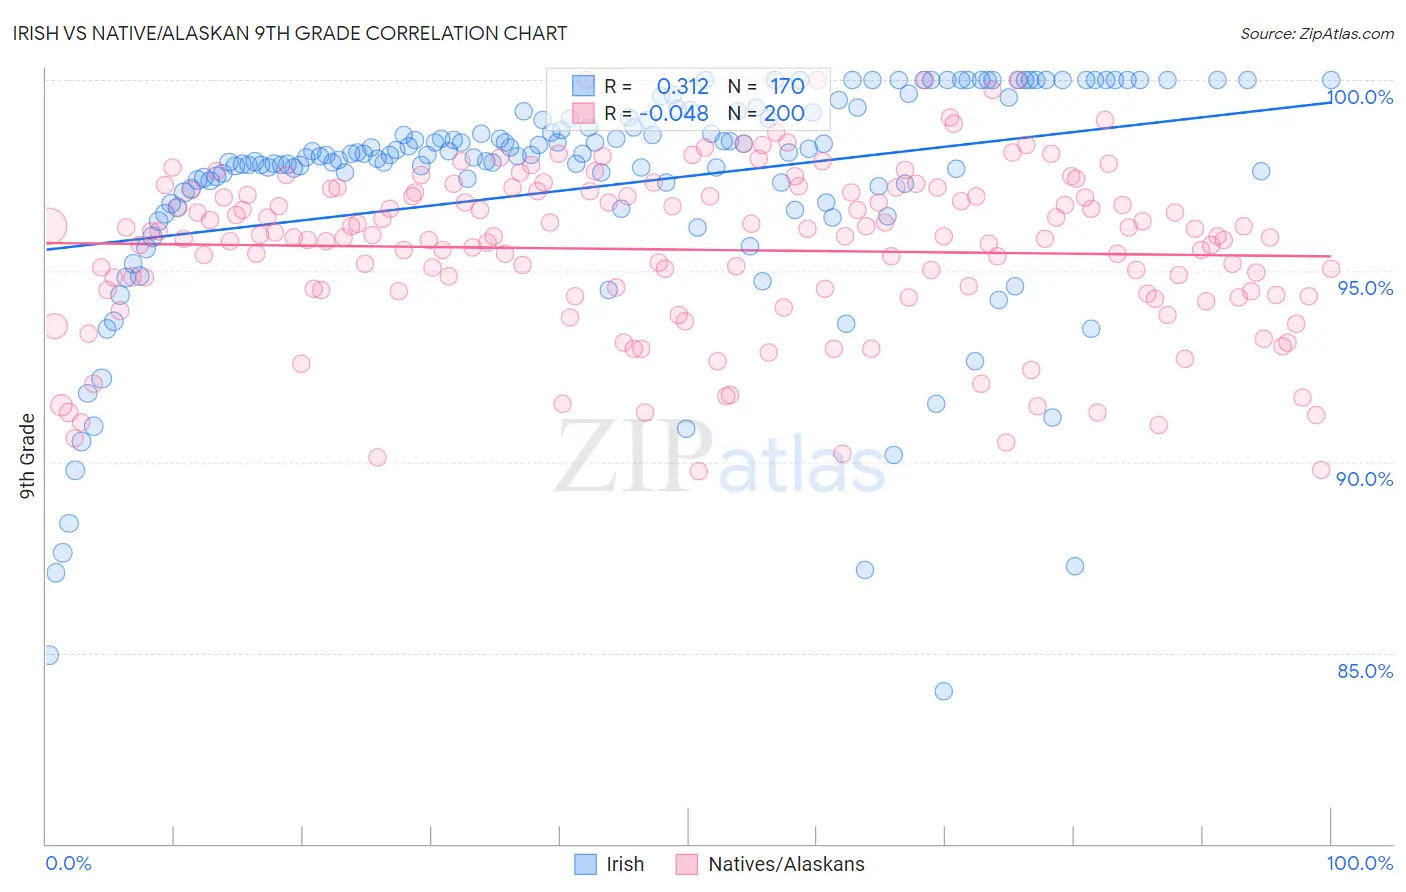
Irish vs Native/Alaskan 9th Grade Correlation Chart
The statistical analysis conducted on geographies consisting of 580,710,287 people shows a mild positive correlation between the proportion of Irish and percentage of population with at least 9th grade education in the United States with a correlation coefficient (R) of 0.312 and weighted average of 96.5%. Similarly, the statistical analysis conducted on geographies consisting of 513,075,822 people shows no correlation between the proportion of Natives/Alaskans and percentage of population with at least 9th grade education in the United States with a correlation coefficient (R) of -0.048 and weighted average of 93.9%, a difference of 2.8%.
9th Grade Correlation Summary
| Measurement | Irish | Native/Alaskan |
| Minimum | 84.0% | 89.8% |
| Maximum | 100.0% | 100.0% |
| Range | 16.0% | 10.2% |
| Mean | 97.2% | 95.6% |
| Median | 98.0% | 95.9% |
| Interquartile 25% (IQ1) | 97.0% | 94.4% |
| Interquartile 75% (IQ3) | 99.0% | 97.1% |
| Interquartile Range (IQR) | 2.0% | 2.6% |
| Standard Deviation (Sample) | 3.1% | 2.2% |
| Standard Deviation (Population) | 3.1% | 2.2% |
Similar Demographics by 9th Grade
Demographics Similar to Irish by 9th Grade
In terms of 9th grade, the demographic groups most similar to Irish are Scottish (96.5%, a difference of 0.0%), Croatian (96.5%, a difference of 0.0%), Danish (96.5%, a difference of 0.010%), English (96.6%, a difference of 0.050%), and Dutch (96.5%, a difference of 0.060%).
| Demographics | Rating | Rank | 9th Grade |
| Germans | 100.0 /100 | #8 | Exceptional 96.7% |
| Tlingit-Haida | 100.0 /100 | #9 | Exceptional 96.6% |
| Lithuanians | 100.0 /100 | #10 | Exceptional 96.6% |
| Finns | 100.0 /100 | #11 | Exceptional 96.6% |
| English | 100.0 /100 | #12 | Exceptional 96.6% |
| Danes | 100.0 /100 | #13 | Exceptional 96.5% |
| Scottish | 100.0 /100 | #14 | Exceptional 96.5% |
| Irish | 100.0 /100 | #15 | Exceptional 96.5% |
| Croatians | 100.0 /100 | #16 | Exceptional 96.5% |
| Dutch | 100.0 /100 | #17 | Exceptional 96.5% |
| Scandinavians | 100.0 /100 | #18 | Exceptional 96.5% |
| Welsh | 100.0 /100 | #19 | Exceptional 96.4% |
| Italians | 100.0 /100 | #20 | Exceptional 96.4% |
| Alaskan Athabascans | 100.0 /100 | #21 | Exceptional 96.4% |
| Europeans | 100.0 /100 | #22 | Exceptional 96.4% |
Demographics Similar to Natives/Alaskans by 9th Grade
In terms of 9th grade, the demographic groups most similar to Natives/Alaskans are Immigrants from Congo (93.9%, a difference of 0.0%), Immigrants from Jamaica (93.9%, a difference of 0.010%), Immigrants from Uzbekistan (93.9%, a difference of 0.010%), Navajo (93.9%, a difference of 0.010%), and South American (93.9%, a difference of 0.030%).
| Demographics | Rating | Rank | 9th Grade |
| Immigrants | Thailand | 0.5 /100 | #258 | Tragic 93.9% |
| Ghanaians | 0.5 /100 | #259 | Tragic 93.9% |
| Pima | 0.4 /100 | #260 | Tragic 93.9% |
| South Americans | 0.4 /100 | #261 | Tragic 93.9% |
| Immigrants | Jamaica | 0.4 /100 | #262 | Tragic 93.9% |
| Immigrants | Uzbekistan | 0.4 /100 | #263 | Tragic 93.9% |
| Immigrants | Congo | 0.4 /100 | #264 | Tragic 93.9% |
| Natives/Alaskans | 0.4 /100 | #265 | Tragic 93.9% |
| Navajo | 0.3 /100 | #266 | Tragic 93.9% |
| Armenians | 0.3 /100 | #267 | Tragic 93.9% |
| Immigrants | Bolivia | 0.3 /100 | #268 | Tragic 93.9% |
| Immigrants | Uruguay | 0.2 /100 | #269 | Tragic 93.8% |
| Yuman | 0.2 /100 | #270 | Tragic 93.8% |
| Immigrants | Ghana | 0.2 /100 | #271 | Tragic 93.8% |
| Immigrants | Western Africa | 0.2 /100 | #272 | Tragic 93.8% |