Cambodian vs Immigrants from Switzerland Professional Degree
COMPARE
Cambodian
Immigrants from Switzerland
Professional Degree
Professional Degree Comparison
Cambodians
Immigrants from Switzerland
6.0%
PROFESSIONAL DEGREE
100.0/ 100
METRIC RATING
40th/ 347
METRIC RANK
7.1%
PROFESSIONAL DEGREE
100.0/ 100
METRIC RATING
8th/ 347
METRIC RANK
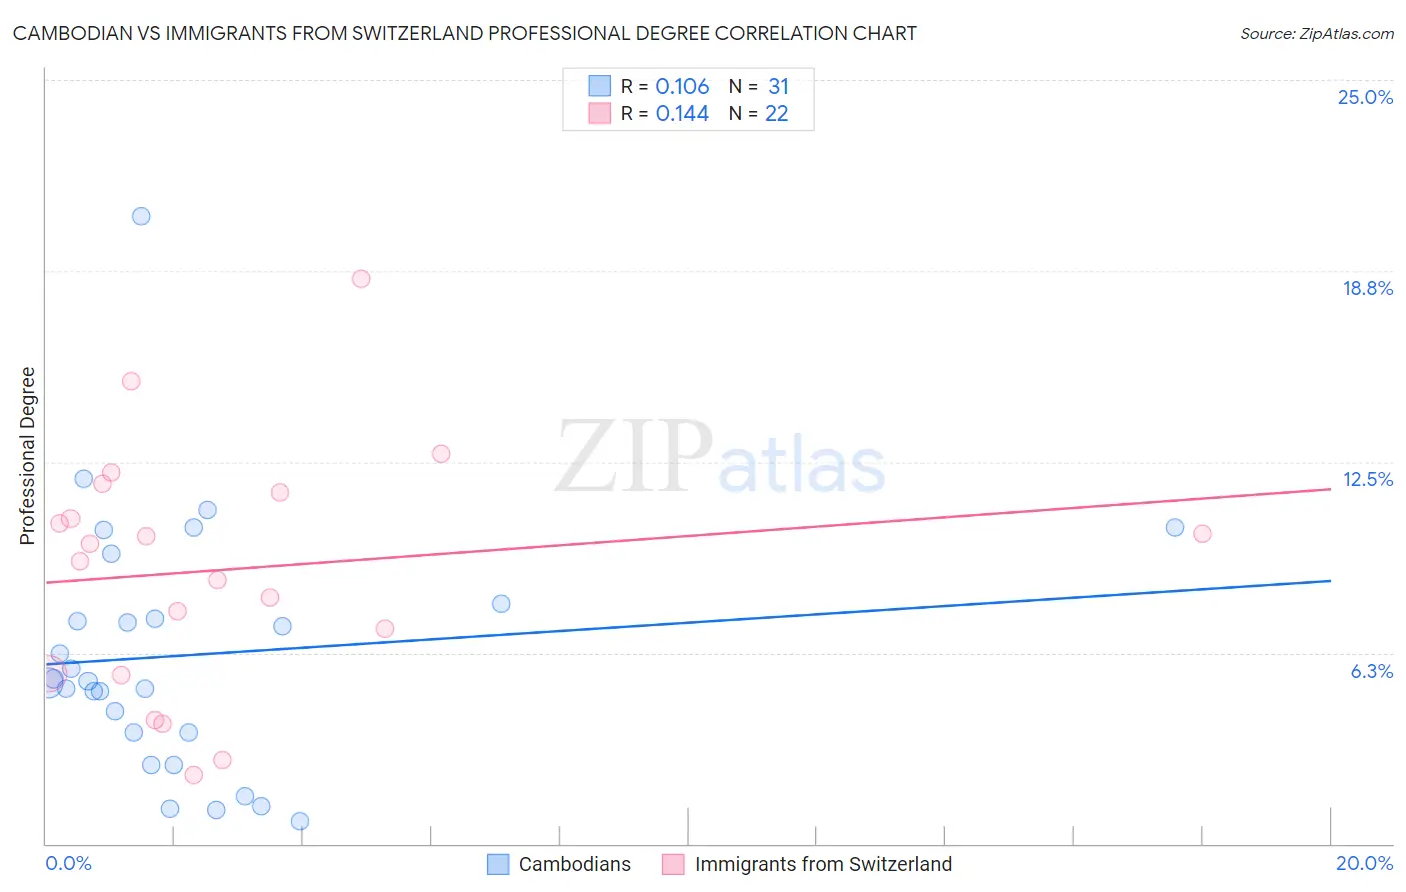
Cambodian vs Immigrants from Switzerland Professional Degree Correlation Chart
The statistical analysis conducted on geographies consisting of 102,442,026 people shows a poor positive correlation between the proportion of Cambodians and percentage of population with at least professional degree education in the United States with a correlation coefficient (R) of 0.106 and weighted average of 6.0%. Similarly, the statistical analysis conducted on geographies consisting of 148,038,589 people shows a poor positive correlation between the proportion of Immigrants from Switzerland and percentage of population with at least professional degree education in the United States with a correlation coefficient (R) of 0.144 and weighted average of 7.1%, a difference of 18.7%.
Professional Degree Correlation Summary
| Measurement | Cambodian | Immigrants from Switzerland |
| Minimum | 0.74% | 2.3% |
| Maximum | 20.5% | 18.5% |
| Range | 19.8% | 16.2% |
| Mean | 6.2% | 9.0% |
| Median | 5.3% | 9.6% |
| Interquartile 25% (IQ1) | 3.6% | 5.5% |
| Interquartile 75% (IQ3) | 7.9% | 11.5% |
| Interquartile Range (IQR) | 4.2% | 5.9% |
| Standard Deviation (Sample) | 4.1% | 4.0% |
| Standard Deviation (Population) | 4.0% | 3.9% |
Similar Demographics by Professional Degree
Demographics Similar to Cambodians by Professional Degree
In terms of professional degree, the demographic groups most similar to Cambodians are New Zealander (6.0%, a difference of 0.18%), Estonian (6.0%, a difference of 0.19%), Immigrants from South Africa (6.0%, a difference of 0.47%), Immigrants from Saudi Arabia (5.9%, a difference of 0.52%), and Argentinean (5.9%, a difference of 0.68%).
| Demographics | Rating | Rank | Professional Degree |
| Burmese | 100.0 /100 | #33 | Exceptional 6.1% |
| Mongolians | 100.0 /100 | #34 | Exceptional 6.1% |
| Immigrants | Korea | 100.0 /100 | #35 | Exceptional 6.1% |
| Immigrants | Russia | 100.0 /100 | #36 | Exceptional 6.0% |
| Immigrants | Austria | 100.0 /100 | #37 | Exceptional 6.0% |
| Immigrants | Norway | 100.0 /100 | #38 | Exceptional 6.0% |
| Immigrants | South Africa | 100.0 /100 | #39 | Exceptional 6.0% |
| Cambodians | 100.0 /100 | #40 | Exceptional 6.0% |
| New Zealanders | 100.0 /100 | #41 | Exceptional 6.0% |
| Estonians | 100.0 /100 | #42 | Exceptional 6.0% |
| Immigrants | Saudi Arabia | 100.0 /100 | #43 | Exceptional 5.9% |
| Argentineans | 100.0 /100 | #44 | Exceptional 5.9% |
| Immigrants | South Central Asia | 100.0 /100 | #45 | Exceptional 5.9% |
| Immigrants | Argentina | 100.0 /100 | #46 | Exceptional 5.9% |
| Australians | 100.0 /100 | #47 | Exceptional 5.9% |
Demographics Similar to Immigrants from Switzerland by Professional Degree
In terms of professional degree, the demographic groups most similar to Immigrants from Switzerland are Eastern European (7.1%, a difference of 0.14%), Immigrants from Taiwan (7.1%, a difference of 0.19%), Immigrants from Belgium (7.0%, a difference of 1.9%), Cypriot (6.9%, a difference of 2.1%), and Israeli (6.9%, a difference of 2.2%).
| Demographics | Rating | Rank | Professional Degree |
| Immigrants | Israel | 100.0 /100 | #1 | Exceptional 7.9% |
| Immigrants | Singapore | 100.0 /100 | #2 | Exceptional 7.7% |
| Iranians | 100.0 /100 | #3 | Exceptional 7.6% |
| Filipinos | 100.0 /100 | #4 | Exceptional 7.6% |
| Immigrants | Iran | 100.0 /100 | #5 | Exceptional 7.3% |
| Okinawans | 100.0 /100 | #6 | Exceptional 7.3% |
| Eastern Europeans | 100.0 /100 | #7 | Exceptional 7.1% |
| Immigrants | Switzerland | 100.0 /100 | #8 | Exceptional 7.1% |
| Immigrants | Taiwan | 100.0 /100 | #9 | Exceptional 7.1% |
| Immigrants | Belgium | 100.0 /100 | #10 | Exceptional 7.0% |
| Cypriots | 100.0 /100 | #11 | Exceptional 6.9% |
| Israelis | 100.0 /100 | #12 | Exceptional 6.9% |
| Immigrants | Australia | 100.0 /100 | #13 | Exceptional 6.9% |
| Immigrants | France | 100.0 /100 | #14 | Exceptional 6.8% |
| Immigrants | China | 100.0 /100 | #15 | Exceptional 6.7% |