Comanche vs Immigrants from Nicaragua No Schooling Completed
COMPARE
Comanche
Immigrants from Nicaragua
No Schooling Completed
No Schooling Completed Comparison
Comanche
Immigrants from Nicaragua
2.1%
NO SCHOOLING COMPLETED
60.7/ 100
METRIC RATING
164th/ 347
METRIC RANK
3.1%
NO SCHOOLING COMPLETED
0.0/ 100
METRIC RATING
315th/ 347
METRIC RANK
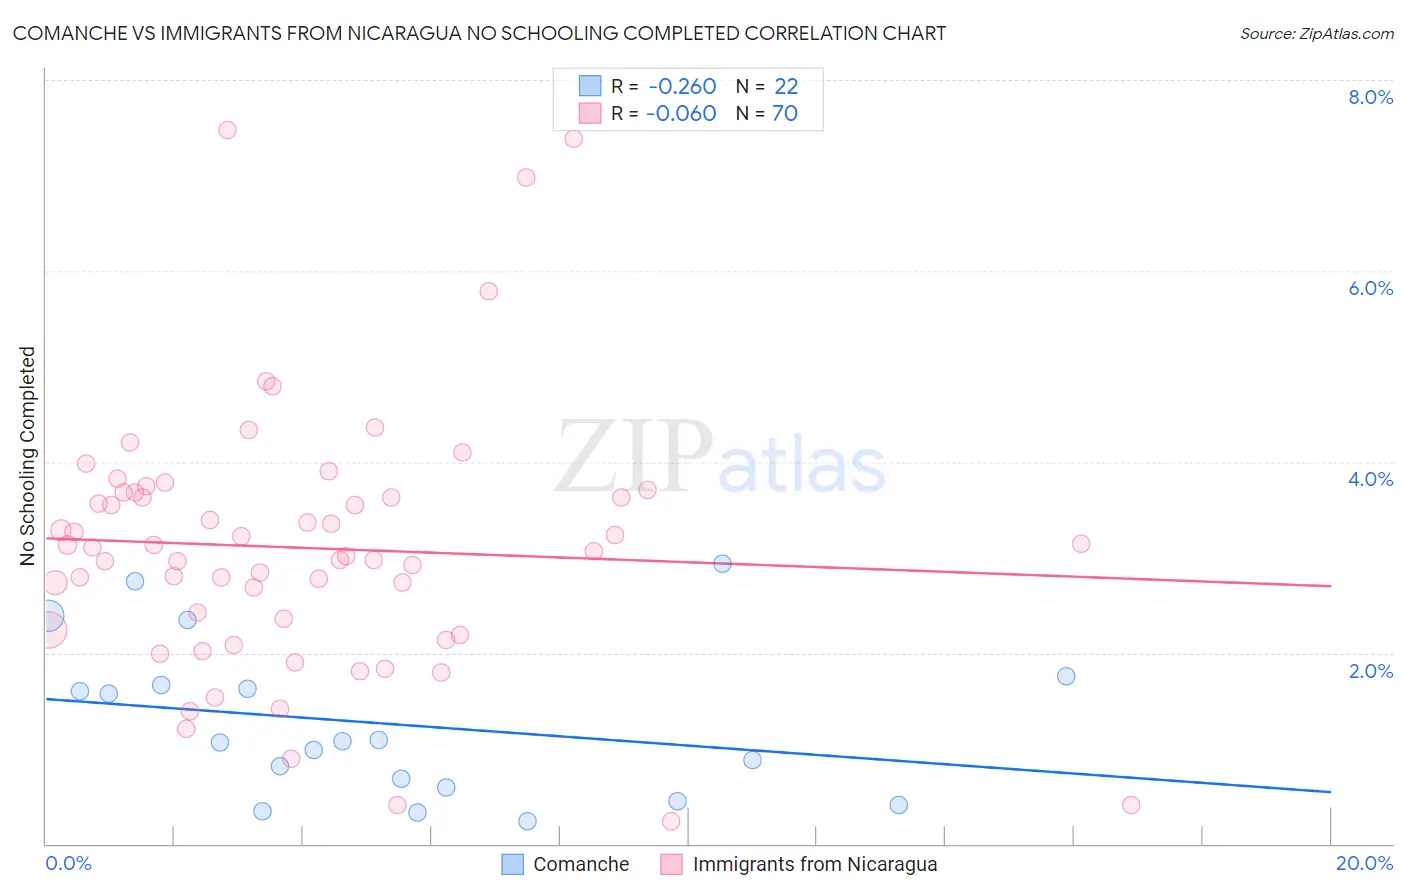
Comanche vs Immigrants from Nicaragua No Schooling Completed Correlation Chart
The statistical analysis conducted on geographies consisting of 109,390,428 people shows a weak negative correlation between the proportion of Comanche and percentage of population with no schooling in the United States with a correlation coefficient (R) of -0.260 and weighted average of 2.1%. Similarly, the statistical analysis conducted on geographies consisting of 235,758,389 people shows a slight negative correlation between the proportion of Immigrants from Nicaragua and percentage of population with no schooling in the United States with a correlation coefficient (R) of -0.060 and weighted average of 3.1%, a difference of 49.2%.
No Schooling Completed Correlation Summary
| Measurement | Comanche | Immigrants from Nicaragua |
| Minimum | 0.23% | 0.23% |
| Maximum | 2.9% | 7.5% |
| Range | 2.7% | 7.2% |
| Mean | 1.3% | 3.1% |
| Median | 1.1% | 3.1% |
| Interquartile 25% (IQ1) | 0.59% | 2.2% |
| Interquartile 75% (IQ3) | 1.7% | 3.7% |
| Interquartile Range (IQR) | 1.1% | 1.4% |
| Standard Deviation (Sample) | 0.81% | 1.4% |
| Standard Deviation (Population) | 0.79% | 1.4% |
Similar Demographics by No Schooling Completed
Demographics Similar to Comanche by No Schooling Completed
In terms of no schooling completed, the demographic groups most similar to Comanche are Brazilian (2.1%, a difference of 0.060%), Dutch West Indian (2.1%, a difference of 0.11%), Egyptian (2.1%, a difference of 0.21%), Albanian (2.1%, a difference of 0.22%), and Cheyenne (2.1%, a difference of 0.29%).
| Demographics | Rating | Rank | No Schooling Completed |
| Immigrants | Sri Lanka | 67.0 /100 | #157 | Good 2.0% |
| Immigrants | Korea | 66.7 /100 | #158 | Good 2.0% |
| Immigrants | Spain | 66.4 /100 | #159 | Good 2.0% |
| Kenyans | 65.7 /100 | #160 | Good 2.0% |
| Ugandans | 64.6 /100 | #161 | Good 2.0% |
| Immigrants | Brazil | 63.8 /100 | #162 | Good 2.1% |
| Albanians | 62.2 /100 | #163 | Good 2.1% |
| Comanche | 60.7 /100 | #164 | Good 2.1% |
| Brazilians | 60.2 /100 | #165 | Good 2.1% |
| Dutch West Indians | 59.9 /100 | #166 | Average 2.1% |
| Egyptians | 59.2 /100 | #167 | Average 2.1% |
| Cheyenne | 58.6 /100 | #168 | Average 2.1% |
| Apache | 56.7 /100 | #169 | Average 2.1% |
| Argentineans | 56.0 /100 | #170 | Average 2.1% |
| Immigrants | Poland | 55.2 /100 | #171 | Average 2.1% |
Demographics Similar to Immigrants from Nicaragua by No Schooling Completed
In terms of no schooling completed, the demographic groups most similar to Immigrants from Nicaragua are Immigrants from Belize (3.1%, a difference of 0.24%), Honduran (3.1%, a difference of 0.33%), Immigrants from Ecuador (3.1%, a difference of 0.36%), Sri Lankan (3.0%, a difference of 0.84%), and Cape Verdean (3.1%, a difference of 0.84%).
| Demographics | Rating | Rank | No Schooling Completed |
| Immigrants | Somalia | 0.0 /100 | #308 | Tragic 3.0% |
| Hispanics or Latinos | 0.0 /100 | #309 | Tragic 3.0% |
| Guyanese | 0.0 /100 | #310 | Tragic 3.0% |
| Immigrants | Azores | 0.0 /100 | #311 | Tragic 3.0% |
| Sri Lankans | 0.0 /100 | #312 | Tragic 3.0% |
| Hondurans | 0.0 /100 | #313 | Tragic 3.1% |
| Immigrants | Belize | 0.0 /100 | #314 | Tragic 3.1% |
| Immigrants | Nicaragua | 0.0 /100 | #315 | Tragic 3.1% |
| Immigrants | Ecuador | 0.0 /100 | #316 | Tragic 3.1% |
| Cape Verdeans | 0.0 /100 | #317 | Tragic 3.1% |
| Immigrants | Guyana | 0.0 /100 | #318 | Tragic 3.1% |
| Immigrants | Burma/Myanmar | 0.0 /100 | #319 | Tragic 3.1% |
| Immigrants | Bangladesh | 0.0 /100 | #320 | Tragic 3.1% |
| Immigrants | Laos | 0.0 /100 | #321 | Tragic 3.1% |
| Immigrants | Honduras | 0.0 /100 | #322 | Tragic 3.2% |