Puget Sound Salish vs British No Schooling Completed
COMPARE
Puget Sound Salish
British
No Schooling Completed
No Schooling Completed Comparison
Puget Sound Salish
British
1.8%
NO SCHOOLING COMPLETED
98.5/ 100
METRIC RATING
95th/ 347
METRIC RANK
1.5%
NO SCHOOLING COMPLETED
100.0/ 100
METRIC RATING
30th/ 347
METRIC RANK
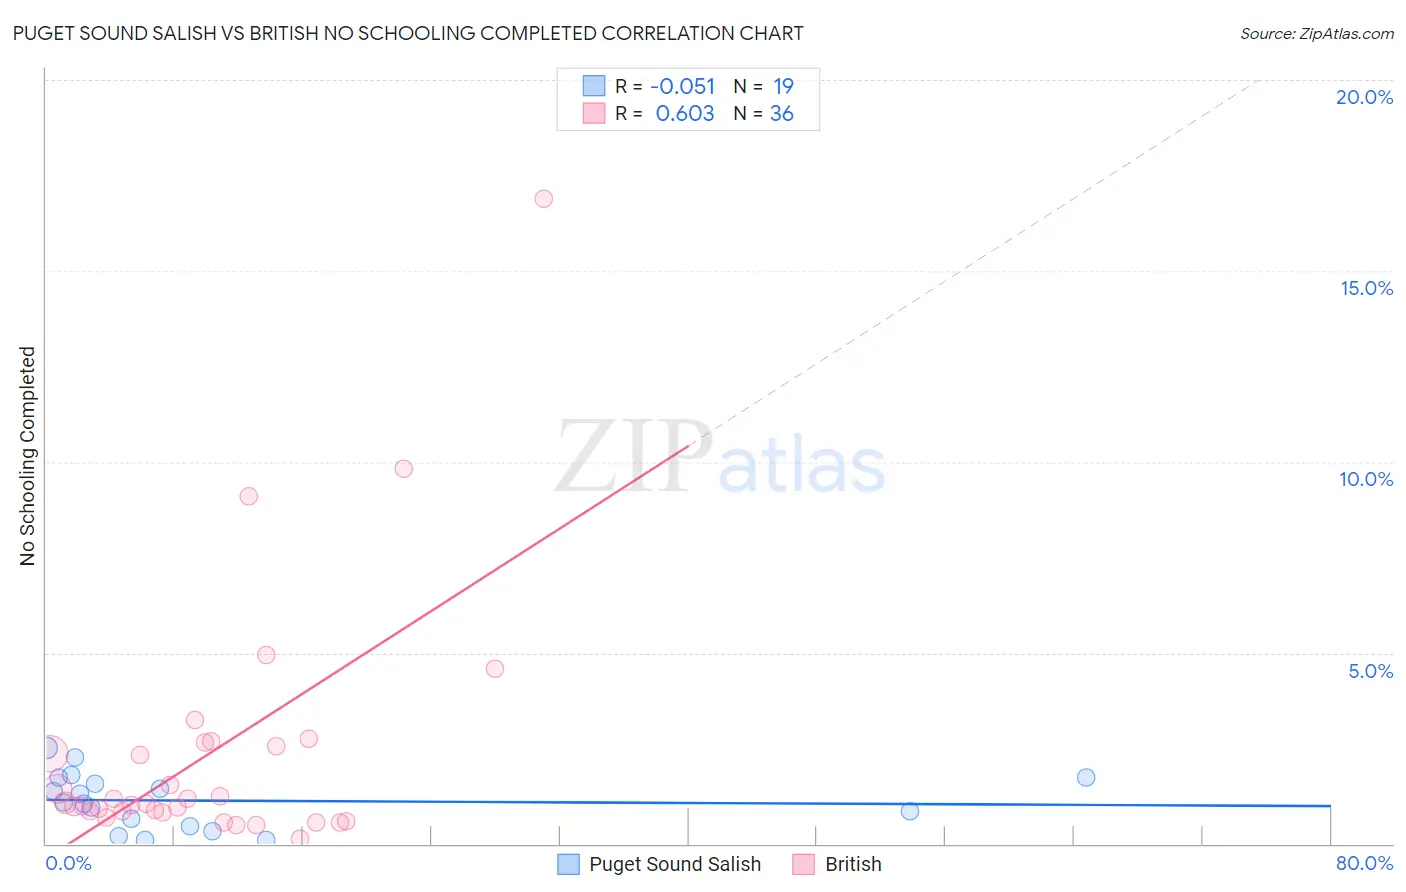
Puget Sound Salish vs British No Schooling Completed Correlation Chart
The statistical analysis conducted on geographies consisting of 45,937,154 people shows a slight negative correlation between the proportion of Puget Sound Salish and percentage of population with no schooling in the United States with a correlation coefficient (R) of -0.051 and weighted average of 1.8%. Similarly, the statistical analysis conducted on geographies consisting of 518,649,413 people shows a significant positive correlation between the proportion of British and percentage of population with no schooling in the United States with a correlation coefficient (R) of 0.603 and weighted average of 1.5%, a difference of 18.1%.
No Schooling Completed Correlation Summary
| Measurement | Puget Sound Salish | British |
| Minimum | 0.082% | 0.14% |
| Maximum | 2.5% | 16.9% |
| Range | 2.4% | 16.8% |
| Mean | 1.1% | 2.4% |
| Median | 1.1% | 1.1% |
| Interquartile 25% (IQ1) | 0.45% | 0.83% |
| Interquartile 75% (IQ3) | 1.7% | 2.6% |
| Interquartile Range (IQR) | 1.3% | 1.8% |
| Standard Deviation (Sample) | 0.72% | 3.3% |
| Standard Deviation (Population) | 0.70% | 3.3% |
Similar Demographics by No Schooling Completed
Demographics Similar to Puget Sound Salish by No Schooling Completed
In terms of no schooling completed, the demographic groups most similar to Puget Sound Salish are Nonimmigrants (1.8%, a difference of 0.010%), Bhutanese (1.8%, a difference of 0.23%), Immigrants from Ireland (1.8%, a difference of 0.41%), Turkish (1.8%, a difference of 0.51%), and Iranian (1.8%, a difference of 0.69%).
| Demographics | Rating | Rank | No Schooling Completed |
| Immigrants | Western Europe | 99.2 /100 | #88 | Exceptional 1.8% |
| South Africans | 99.1 /100 | #89 | Exceptional 1.8% |
| Sioux | 99.0 /100 | #90 | Exceptional 1.8% |
| Immigrants | Germany | 99.0 /100 | #91 | Exceptional 1.8% |
| Romanians | 98.8 /100 | #92 | Exceptional 1.8% |
| Turks | 98.7 /100 | #93 | Exceptional 1.8% |
| Immigrants | Nonimmigrants | 98.5 /100 | #94 | Exceptional 1.8% |
| Puget Sound Salish | 98.5 /100 | #95 | Exceptional 1.8% |
| Bhutanese | 98.4 /100 | #96 | Exceptional 1.8% |
| Immigrants | Ireland | 98.4 /100 | #97 | Exceptional 1.8% |
| Iranians | 98.2 /100 | #98 | Exceptional 1.8% |
| Choctaw | 98.1 /100 | #99 | Exceptional 1.8% |
| Immigrants | Singapore | 98.0 /100 | #100 | Exceptional 1.8% |
| Immigrants | Czechoslovakia | 97.9 /100 | #101 | Exceptional 1.8% |
| Immigrants | Switzerland | 97.9 /100 | #102 | Exceptional 1.8% |
Demographics Similar to British by No Schooling Completed
In terms of no schooling completed, the demographic groups most similar to British are Inupiat (1.5%, a difference of 0.030%), Swiss (1.5%, a difference of 0.42%), Lumbee (1.5%, a difference of 0.48%), Italian (1.5%, a difference of 1.1%), and Latvian (1.5%, a difference of 1.4%).
| Demographics | Rating | Rank | No Schooling Completed |
| Europeans | 100.0 /100 | #23 | Exceptional 1.5% |
| Pennsylvania Germans | 100.0 /100 | #24 | Exceptional 1.5% |
| French | 100.0 /100 | #25 | Exceptional 1.5% |
| Czechs | 100.0 /100 | #26 | Exceptional 1.5% |
| Scandinavians | 100.0 /100 | #27 | Exceptional 1.5% |
| French Canadians | 100.0 /100 | #28 | Exceptional 1.5% |
| Lumbee | 100.0 /100 | #29 | Exceptional 1.5% |
| British | 100.0 /100 | #30 | Exceptional 1.5% |
| Inupiat | 100.0 /100 | #31 | Exceptional 1.5% |
| Swiss | 100.0 /100 | #32 | Exceptional 1.5% |
| Italians | 100.0 /100 | #33 | Exceptional 1.5% |
| Latvians | 100.0 /100 | #34 | Exceptional 1.5% |
| Eastern Europeans | 100.0 /100 | #35 | Exceptional 1.6% |
| Aleuts | 99.9 /100 | #36 | Exceptional 1.6% |
| Belgians | 99.9 /100 | #37 | Exceptional 1.6% |