Colville vs Immigrants from Eritrea Single Father Households
COMPARE
Colville
Immigrants from Eritrea
Single Father Households
Single Father Households Comparison
Colville
Immigrants from Eritrea
3.3%
SINGLE FATHER HOUSEHOLDS
0.0/ 100
METRIC RATING
335th/ 347
METRIC RANK
2.5%
SINGLE FATHER HOUSEHOLDS
2.0/ 100
METRIC RATING
252nd/ 347
METRIC RANK
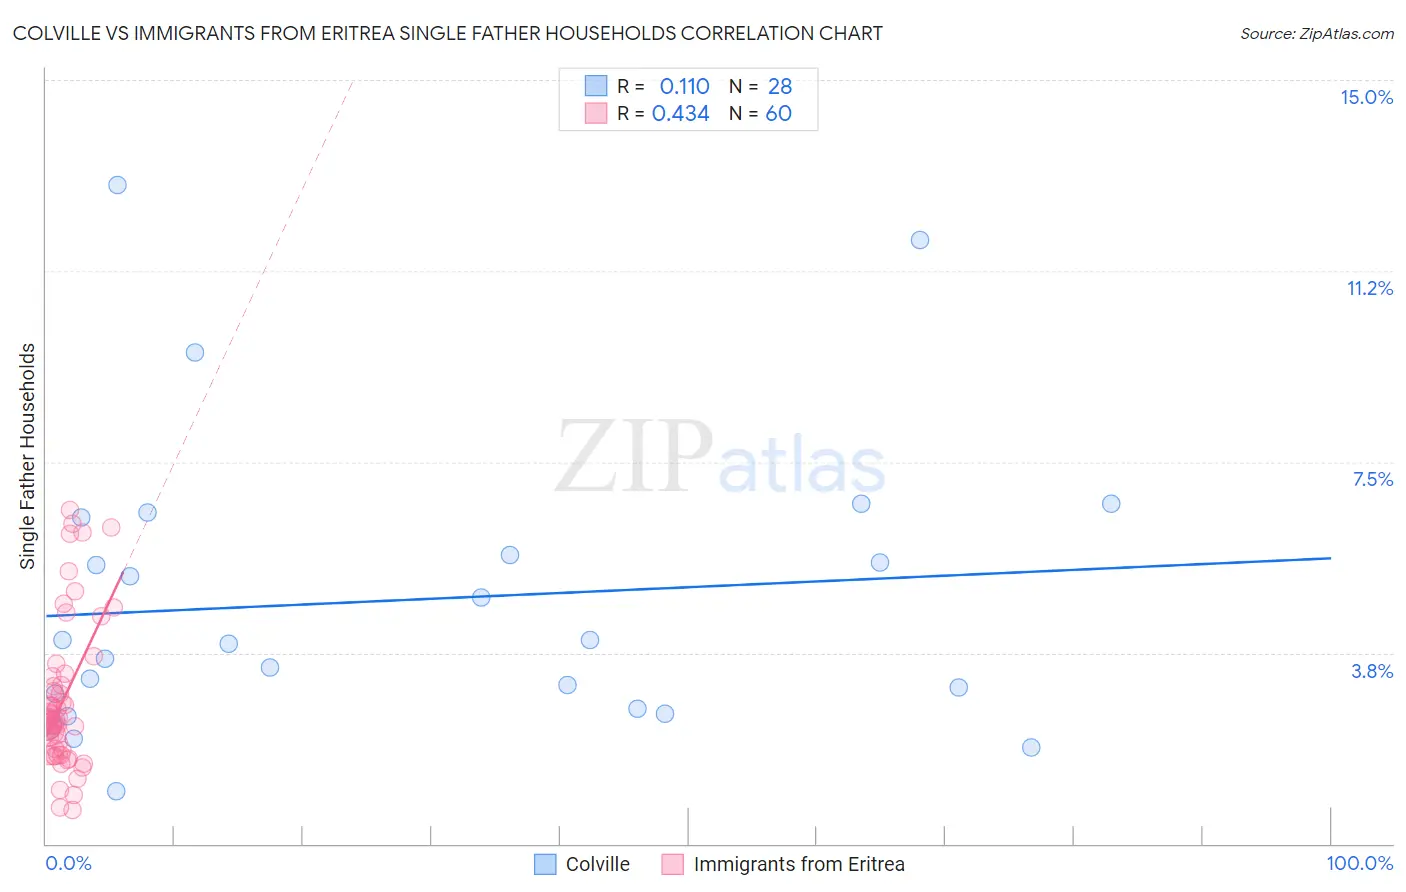
Colville vs Immigrants from Eritrea Single Father Households Correlation Chart
The statistical analysis conducted on geographies consisting of 34,617,249 people shows a poor positive correlation between the proportion of Colville and percentage of single father households in the United States with a correlation coefficient (R) of 0.110 and weighted average of 3.3%. Similarly, the statistical analysis conducted on geographies consisting of 104,791,168 people shows a moderate positive correlation between the proportion of Immigrants from Eritrea and percentage of single father households in the United States with a correlation coefficient (R) of 0.434 and weighted average of 2.5%, a difference of 31.5%.
Single Father Households Correlation Summary
| Measurement | Colville | Immigrants from Eritrea |
| Minimum | 1.0% | 0.67% |
| Maximum | 12.9% | 6.6% |
| Range | 11.9% | 5.9% |
| Mean | 4.8% | 2.8% |
| Median | 4.0% | 2.4% |
| Interquartile 25% (IQ1) | 2.8% | 1.8% |
| Interquartile 75% (IQ3) | 6.0% | 3.2% |
| Interquartile Range (IQR) | 3.2% | 1.4% |
| Standard Deviation (Sample) | 2.9% | 1.4% |
| Standard Deviation (Population) | 2.8% | 1.4% |
Similar Demographics by Single Father Households
Demographics Similar to Colville by Single Father Households
In terms of single father households, the demographic groups most similar to Colville are Yuman (3.3%, a difference of 0.020%), Paiute (3.3%, a difference of 0.030%), Pueblo (3.3%, a difference of 0.28%), Sioux (3.3%, a difference of 0.96%), and Alaskan Athabascan (3.4%, a difference of 2.4%).
| Demographics | Rating | Rank | Single Father Households |
| Immigrants | Cabo Verde | 0.0 /100 | #328 | Tragic 3.1% |
| Chippewa | 0.0 /100 | #329 | Tragic 3.1% |
| Nepalese | 0.0 /100 | #330 | Tragic 3.1% |
| Navajo | 0.0 /100 | #331 | Tragic 3.2% |
| Yaqui | 0.0 /100 | #332 | Tragic 3.2% |
| Natives/Alaskans | 0.0 /100 | #333 | Tragic 3.2% |
| Yuman | 0.0 /100 | #334 | Tragic 3.3% |
| Colville | 0.0 /100 | #335 | Tragic 3.3% |
| Paiute | 0.0 /100 | #336 | Tragic 3.3% |
| Pueblo | 0.0 /100 | #337 | Tragic 3.3% |
| Sioux | 0.0 /100 | #338 | Tragic 3.3% |
| Alaskan Athabascans | 0.0 /100 | #339 | Tragic 3.4% |
| Alaska Natives | 0.0 /100 | #340 | Tragic 3.5% |
| Crow | 0.0 /100 | #341 | Tragic 3.5% |
| Tohono O'odham | 0.0 /100 | #342 | Tragic 3.8% |
Demographics Similar to Immigrants from Eritrea by Single Father Households
In terms of single father households, the demographic groups most similar to Immigrants from Eritrea are Liberian (2.5%, a difference of 0.020%), Immigrants from Somalia (2.5%, a difference of 0.070%), Immigrants from Thailand (2.5%, a difference of 0.10%), Somali (2.5%, a difference of 0.11%), and Immigrants from Cameroon (2.5%, a difference of 0.28%).
| Demographics | Rating | Rank | Single Father Households |
| Basques | 2.5 /100 | #245 | Tragic 2.5% |
| Native Hawaiians | 2.5 /100 | #246 | Tragic 2.5% |
| Delaware | 2.5 /100 | #247 | Tragic 2.5% |
| Bahamians | 2.4 /100 | #248 | Tragic 2.5% |
| Immigrants | Cameroon | 2.3 /100 | #249 | Tragic 2.5% |
| Somalis | 2.1 /100 | #250 | Tragic 2.5% |
| Liberians | 2.0 /100 | #251 | Tragic 2.5% |
| Immigrants | Eritrea | 2.0 /100 | #252 | Tragic 2.5% |
| Immigrants | Somalia | 1.9 /100 | #253 | Tragic 2.5% |
| Immigrants | Thailand | 1.8 /100 | #254 | Tragic 2.5% |
| Tongans | 1.5 /100 | #255 | Tragic 2.5% |
| Potawatomi | 1.4 /100 | #256 | Tragic 2.5% |
| Immigrants | Congo | 1.2 /100 | #257 | Tragic 2.5% |
| Spanish | 1.1 /100 | #258 | Tragic 2.5% |
| Comanche | 1.0 /100 | #259 | Tragic 2.5% |