Nepalese vs Mongolian 7th Grade
COMPARE
Nepalese
Mongolian
7th Grade
7th Grade Comparison
Nepalese
Mongolians
93.2%
7TH GRADE
0.0/ 100
METRIC RATING
326th/ 347
METRIC RANK
96.0%
7TH GRADE
50.0/ 100
METRIC RATING
174th/ 347
METRIC RANK
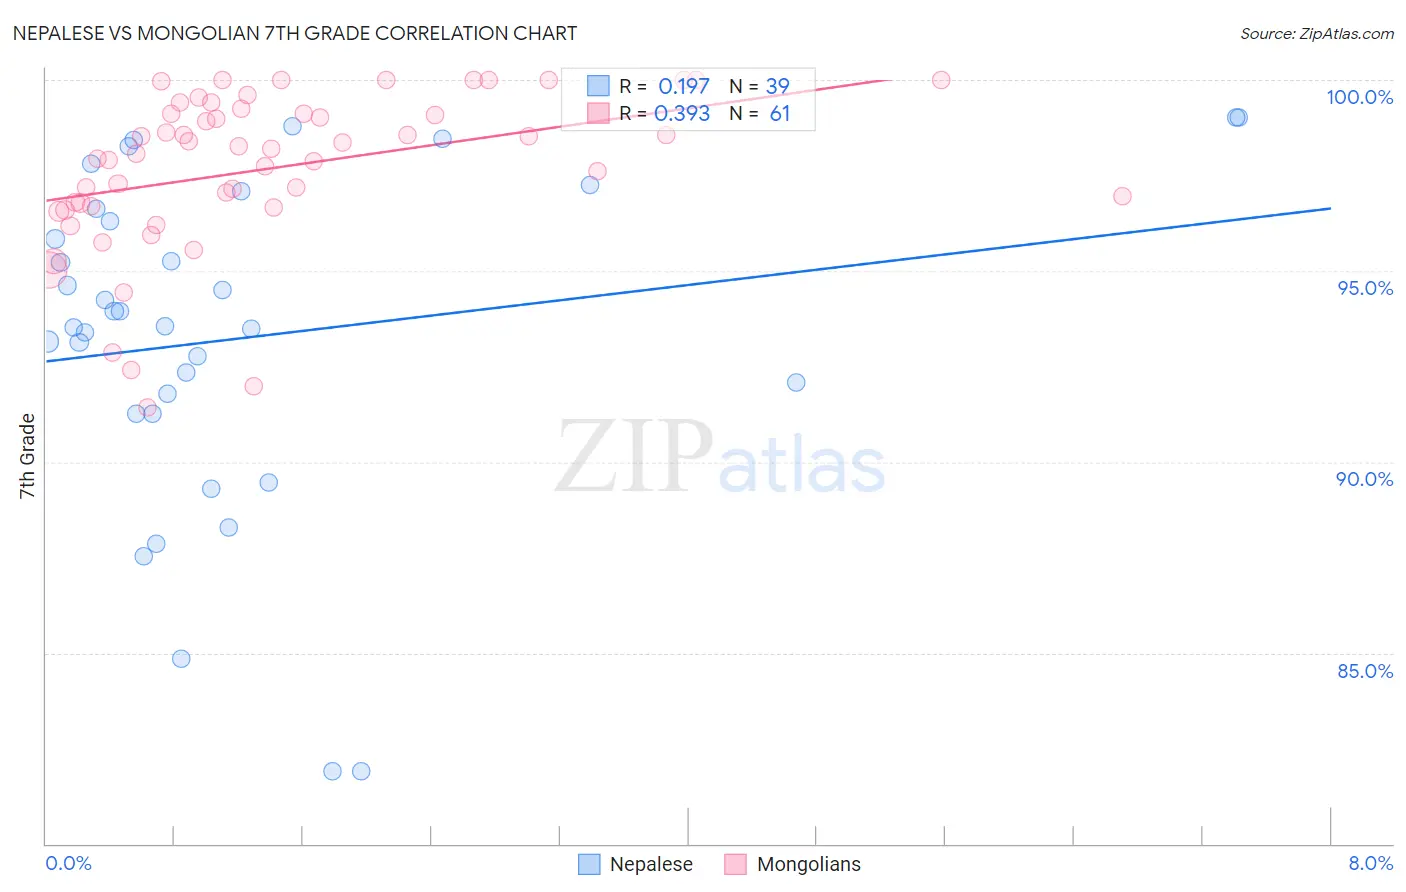
Nepalese vs Mongolian 7th Grade Correlation Chart
The statistical analysis conducted on geographies consisting of 24,519,269 people shows a poor positive correlation between the proportion of Nepalese and percentage of population with at least 7th grade education in the United States with a correlation coefficient (R) of 0.197 and weighted average of 93.2%. Similarly, the statistical analysis conducted on geographies consisting of 140,362,004 people shows a mild positive correlation between the proportion of Mongolians and percentage of population with at least 7th grade education in the United States with a correlation coefficient (R) of 0.393 and weighted average of 96.0%, a difference of 3.1%.
7th Grade Correlation Summary
| Measurement | Nepalese | Mongolian |
| Minimum | 81.9% | 91.4% |
| Maximum | 99.0% | 100.0% |
| Range | 17.1% | 8.6% |
| Mean | 93.3% | 97.7% |
| Median | 93.6% | 98.2% |
| Interquartile 25% (IQ1) | 91.3% | 96.7% |
| Interquartile 75% (IQ3) | 96.6% | 99.2% |
| Interquartile Range (IQR) | 5.4% | 2.5% |
| Standard Deviation (Sample) | 4.4% | 2.1% |
| Standard Deviation (Population) | 4.3% | 2.0% |
Similar Demographics by 7th Grade
Demographics Similar to Nepalese by 7th Grade
In terms of 7th grade, the demographic groups most similar to Nepalese are Immigrants from Cabo Verde (93.1%, a difference of 0.070%), Central American Indian (93.3%, a difference of 0.11%), Dominican (93.3%, a difference of 0.18%), Immigrants from Belize (93.4%, a difference of 0.19%), and Immigrants from Nicaragua (93.0%, a difference of 0.20%).
| Demographics | Rating | Rank | 7th Grade |
| Immigrants | Cambodia | 0.0 /100 | #319 | Tragic 93.7% |
| Immigrants | Fiji | 0.0 /100 | #320 | Tragic 93.5% |
| Belizeans | 0.0 /100 | #321 | Tragic 93.5% |
| Nicaraguans | 0.0 /100 | #322 | Tragic 93.5% |
| Immigrants | Belize | 0.0 /100 | #323 | Tragic 93.4% |
| Dominicans | 0.0 /100 | #324 | Tragic 93.3% |
| Central American Indians | 0.0 /100 | #325 | Tragic 93.3% |
| Nepalese | 0.0 /100 | #326 | Tragic 93.2% |
| Immigrants | Cabo Verde | 0.0 /100 | #327 | Tragic 93.1% |
| Immigrants | Nicaragua | 0.0 /100 | #328 | Tragic 93.0% |
| Immigrants | Azores | 0.0 /100 | #329 | Tragic 93.0% |
| Immigrants | Dominican Republic | 0.0 /100 | #330 | Tragic 92.9% |
| Hondurans | 0.0 /100 | #331 | Tragic 92.9% |
| Hispanics or Latinos | 0.0 /100 | #332 | Tragic 92.7% |
| Immigrants | Armenia | 0.0 /100 | #333 | Tragic 92.7% |
Demographics Similar to Mongolians by 7th Grade
In terms of 7th grade, the demographic groups most similar to Mongolians are Immigrants from Albania (96.0%, a difference of 0.0%), Black/African American (96.0%, a difference of 0.0%), Chilean (96.0%, a difference of 0.0%), Venezuelan (96.0%, a difference of 0.010%), and Immigrants from Korea (96.0%, a difference of 0.010%).
| Demographics | Rating | Rank | 7th Grade |
| Immigrants | Sri Lanka | 59.9 /100 | #167 | Average 96.1% |
| Immigrants | Poland | 59.0 /100 | #168 | Average 96.1% |
| Ute | 55.8 /100 | #169 | Average 96.1% |
| Immigrants | Ukraine | 55.0 /100 | #170 | Average 96.1% |
| Egyptians | 54.2 /100 | #171 | Average 96.1% |
| Venezuelans | 51.4 /100 | #172 | Average 96.0% |
| Immigrants | Albania | 50.4 /100 | #173 | Average 96.0% |
| Mongolians | 50.0 /100 | #174 | Average 96.0% |
| Blacks/African Americans | 49.5 /100 | #175 | Average 96.0% |
| Chileans | 49.3 /100 | #176 | Average 96.0% |
| Immigrants | Korea | 49.2 /100 | #177 | Average 96.0% |
| Marshallese | 48.4 /100 | #178 | Average 96.0% |
| Immigrants | Iran | 47.8 /100 | #179 | Average 96.0% |
| Immigrants | Brazil | 46.8 /100 | #180 | Average 96.0% |
| Pakistanis | 44.5 /100 | #181 | Average 96.0% |