Inupiat vs Mongolian 7th Grade
COMPARE
Inupiat
Mongolian
7th Grade
7th Grade Comparison
Inupiat
Mongolians
97.4%
7TH GRADE
100.0/ 100
METRIC RATING
21st/ 347
METRIC RANK
96.0%
7TH GRADE
50.0/ 100
METRIC RATING
174th/ 347
METRIC RANK
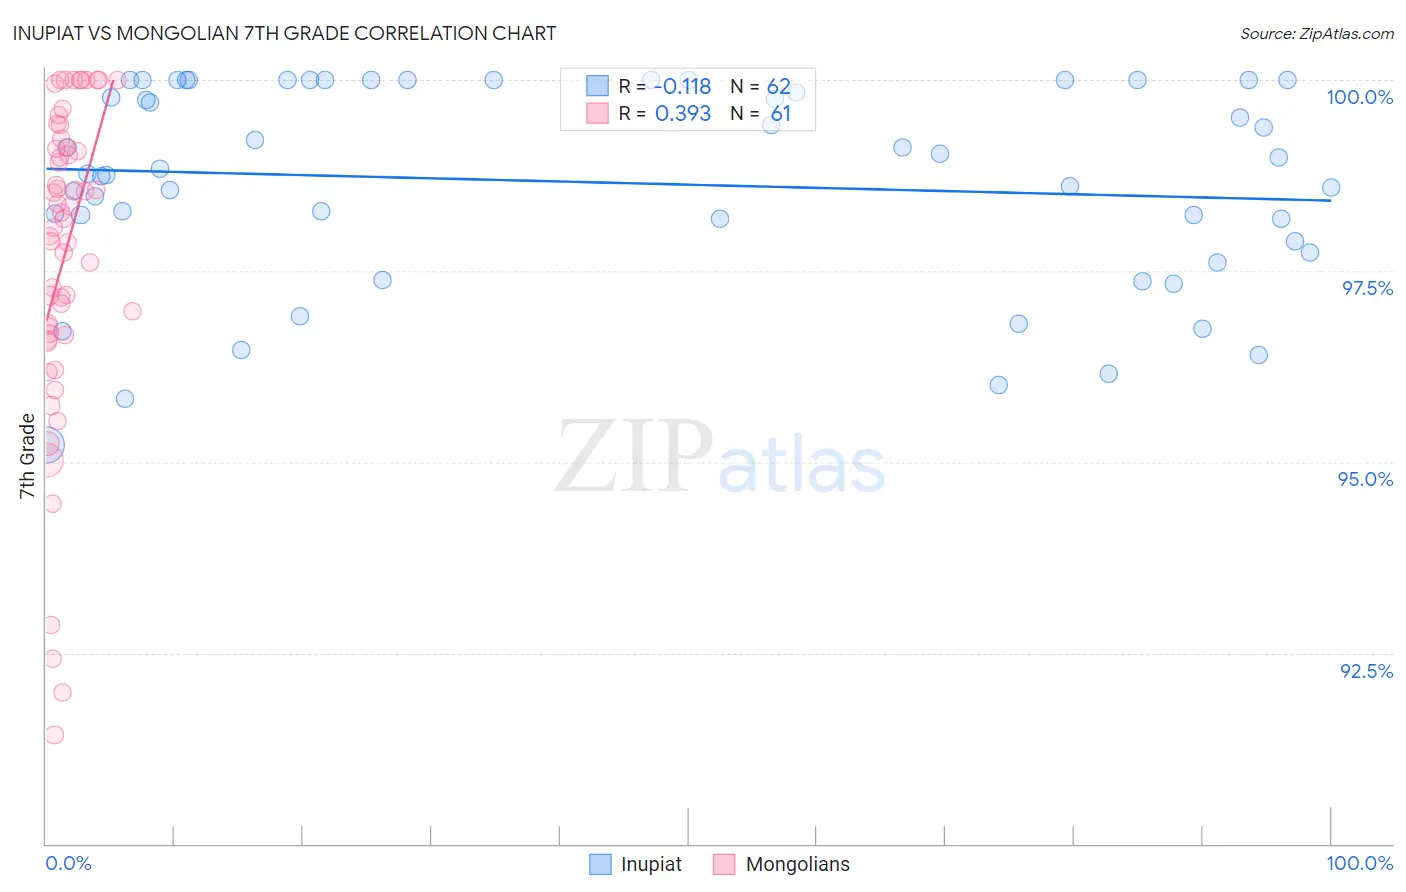
Inupiat vs Mongolian 7th Grade Correlation Chart
The statistical analysis conducted on geographies consisting of 96,348,974 people shows a poor negative correlation between the proportion of Inupiat and percentage of population with at least 7th grade education in the United States with a correlation coefficient (R) of -0.118 and weighted average of 97.4%. Similarly, the statistical analysis conducted on geographies consisting of 140,362,004 people shows a mild positive correlation between the proportion of Mongolians and percentage of population with at least 7th grade education in the United States with a correlation coefficient (R) of 0.393 and weighted average of 96.0%, a difference of 1.5%.
7th Grade Correlation Summary
| Measurement | Inupiat | Mongolian |
| Minimum | 95.2% | 91.4% |
| Maximum | 100.0% | 100.0% |
| Range | 4.8% | 8.6% |
| Mean | 98.7% | 97.7% |
| Median | 98.8% | 98.2% |
| Interquartile 25% (IQ1) | 97.9% | 96.7% |
| Interquartile 75% (IQ3) | 100.0% | 99.2% |
| Interquartile Range (IQR) | 2.1% | 2.5% |
| Standard Deviation (Sample) | 1.3% | 2.1% |
| Standard Deviation (Population) | 1.3% | 2.0% |
Similar Demographics by 7th Grade
Demographics Similar to Inupiat by 7th Grade
In terms of 7th grade, the demographic groups most similar to Inupiat are French Canadian (97.4%, a difference of 0.0%), Yup'ik (97.4%, a difference of 0.010%), Croatian (97.4%, a difference of 0.020%), Welsh (97.4%, a difference of 0.030%), and French (97.4%, a difference of 0.040%).
| Demographics | Rating | Rank | 7th Grade |
| Pennsylvania Germans | 100.0 /100 | #14 | Exceptional 97.6% |
| English | 100.0 /100 | #15 | Exceptional 97.6% |
| Irish | 100.0 /100 | #16 | Exceptional 97.5% |
| Scottish | 100.0 /100 | #17 | Exceptional 97.5% |
| Tlingit-Haida | 100.0 /100 | #18 | Exceptional 97.5% |
| Lithuanians | 100.0 /100 | #19 | Exceptional 97.5% |
| Yup'ik | 100.0 /100 | #20 | Exceptional 97.4% |
| Inupiat | 100.0 /100 | #21 | Exceptional 97.4% |
| French Canadians | 100.0 /100 | #22 | Exceptional 97.4% |
| Croatians | 100.0 /100 | #23 | Exceptional 97.4% |
| Welsh | 100.0 /100 | #24 | Exceptional 97.4% |
| French | 100.0 /100 | #25 | Exceptional 97.4% |
| Scotch-Irish | 100.0 /100 | #26 | Exceptional 97.4% |
| Danes | 100.0 /100 | #27 | Exceptional 97.4% |
| Sioux | 100.0 /100 | #28 | Exceptional 97.4% |
Demographics Similar to Mongolians by 7th Grade
In terms of 7th grade, the demographic groups most similar to Mongolians are Immigrants from Albania (96.0%, a difference of 0.0%), Black/African American (96.0%, a difference of 0.0%), Chilean (96.0%, a difference of 0.0%), Venezuelan (96.0%, a difference of 0.010%), and Immigrants from Korea (96.0%, a difference of 0.010%).
| Demographics | Rating | Rank | 7th Grade |
| Immigrants | Sri Lanka | 59.9 /100 | #167 | Average 96.1% |
| Immigrants | Poland | 59.0 /100 | #168 | Average 96.1% |
| Ute | 55.8 /100 | #169 | Average 96.1% |
| Immigrants | Ukraine | 55.0 /100 | #170 | Average 96.1% |
| Egyptians | 54.2 /100 | #171 | Average 96.1% |
| Venezuelans | 51.4 /100 | #172 | Average 96.0% |
| Immigrants | Albania | 50.4 /100 | #173 | Average 96.0% |
| Mongolians | 50.0 /100 | #174 | Average 96.0% |
| Blacks/African Americans | 49.5 /100 | #175 | Average 96.0% |
| Chileans | 49.3 /100 | #176 | Average 96.0% |
| Immigrants | Korea | 49.2 /100 | #177 | Average 96.0% |
| Marshallese | 48.4 /100 | #178 | Average 96.0% |
| Immigrants | Iran | 47.8 /100 | #179 | Average 96.0% |
| Immigrants | Brazil | 46.8 /100 | #180 | Average 96.0% |
| Pakistanis | 44.5 /100 | #181 | Average 96.0% |