Immigrants from Sierra Leone vs Mongolian 7th Grade
COMPARE
Immigrants from Sierra Leone
Mongolian
7th Grade
7th Grade Comparison
Immigrants from Sierra Leone
Mongolians
95.5%
7TH GRADE
2.0/ 100
METRIC RATING
240th/ 347
METRIC RANK
96.0%
7TH GRADE
50.0/ 100
METRIC RATING
174th/ 347
METRIC RANK
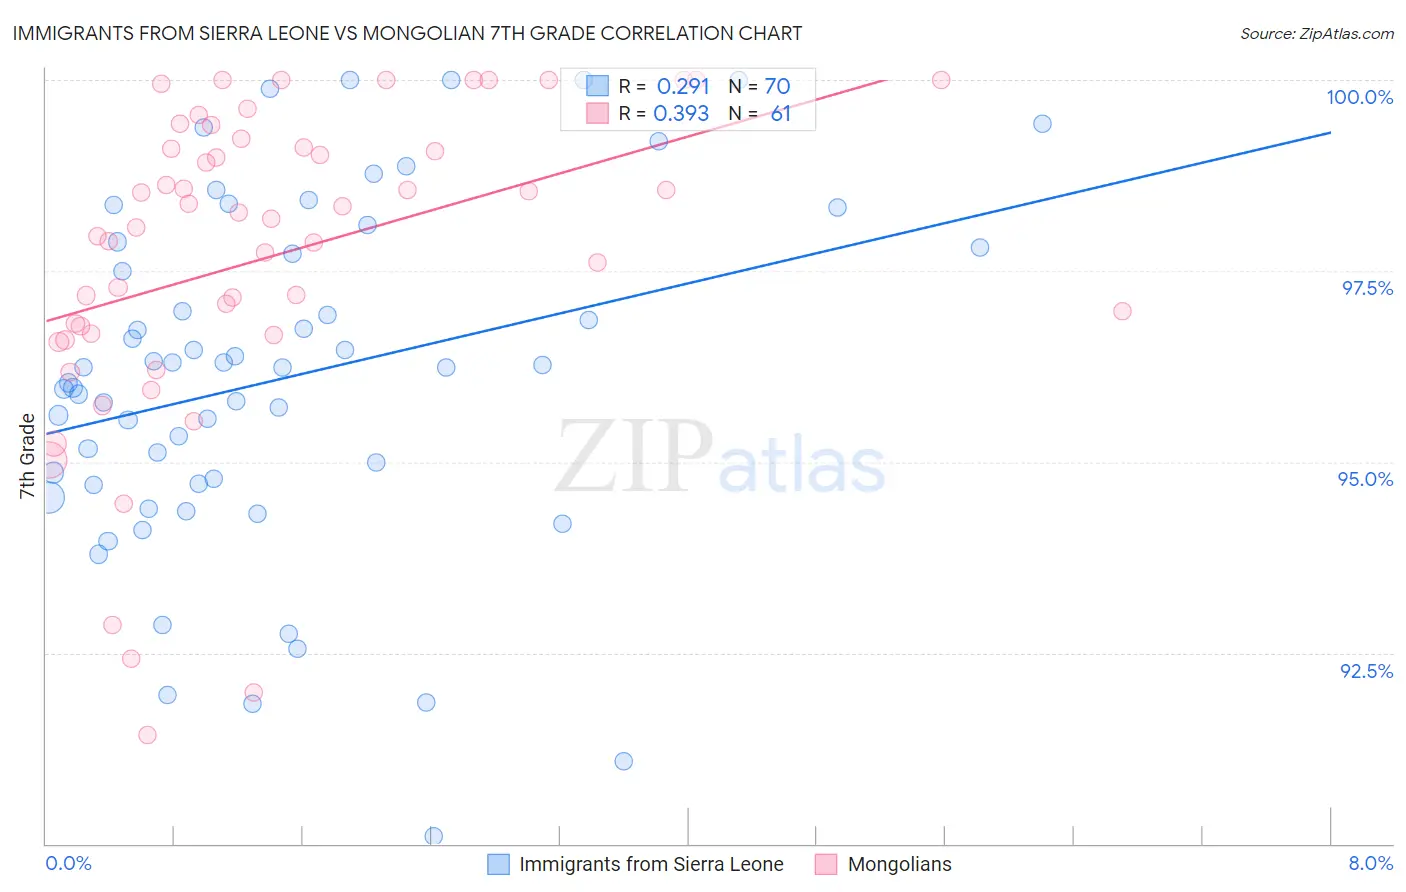
Immigrants from Sierra Leone vs Mongolian 7th Grade Correlation Chart
The statistical analysis conducted on geographies consisting of 101,634,956 people shows a weak positive correlation between the proportion of Immigrants from Sierra Leone and percentage of population with at least 7th grade education in the United States with a correlation coefficient (R) of 0.291 and weighted average of 95.5%. Similarly, the statistical analysis conducted on geographies consisting of 140,362,004 people shows a mild positive correlation between the proportion of Mongolians and percentage of population with at least 7th grade education in the United States with a correlation coefficient (R) of 0.393 and weighted average of 96.0%, a difference of 0.60%.
7th Grade Correlation Summary
| Measurement | Immigrants from Sierra Leone | Mongolian |
| Minimum | 90.1% | 91.4% |
| Maximum | 100.0% | 100.0% |
| Range | 9.9% | 8.6% |
| Mean | 96.1% | 97.7% |
| Median | 96.2% | 98.2% |
| Interquartile 25% (IQ1) | 94.7% | 96.7% |
| Interquartile 75% (IQ3) | 97.8% | 99.2% |
| Interquartile Range (IQR) | 3.1% | 2.5% |
| Standard Deviation (Sample) | 2.3% | 2.1% |
| Standard Deviation (Population) | 2.3% | 2.0% |
Similar Demographics by 7th Grade
Demographics Similar to Immigrants from Sierra Leone by 7th Grade
In terms of 7th grade, the demographic groups most similar to Immigrants from Sierra Leone are South American Indian (95.5%, a difference of 0.0%), Immigrants from Senegal (95.5%, a difference of 0.0%), Indian (Asian) (95.5%, a difference of 0.020%), Jamaican (95.5%, a difference of 0.020%), and Immigrants from Asia (95.5%, a difference of 0.030%).
| Demographics | Rating | Rank | 7th Grade |
| Immigrants | Indonesia | 3.3 /100 | #233 | Tragic 95.5% |
| Nigerians | 3.0 /100 | #234 | Tragic 95.5% |
| Immigrants | Africa | 2.7 /100 | #235 | Tragic 95.5% |
| Asians | 2.6 /100 | #236 | Tragic 95.5% |
| Immigrants | Asia | 2.3 /100 | #237 | Tragic 95.5% |
| Indians (Asian) | 2.3 /100 | #238 | Tragic 95.5% |
| Jamaicans | 2.2 /100 | #239 | Tragic 95.5% |
| Immigrants | Sierra Leone | 2.0 /100 | #240 | Tragic 95.5% |
| South American Indians | 2.0 /100 | #241 | Tragic 95.5% |
| Immigrants | Senegal | 1.9 /100 | #242 | Tragic 95.5% |
| U.S. Virgin Islanders | 1.6 /100 | #243 | Tragic 95.4% |
| Uruguayans | 1.6 /100 | #244 | Tragic 95.4% |
| Immigrants | Middle Africa | 1.5 /100 | #245 | Tragic 95.4% |
| Ethiopians | 1.5 /100 | #246 | Tragic 95.4% |
| Tongans | 1.3 /100 | #247 | Tragic 95.4% |
Demographics Similar to Mongolians by 7th Grade
In terms of 7th grade, the demographic groups most similar to Mongolians are Immigrants from Albania (96.0%, a difference of 0.0%), Black/African American (96.0%, a difference of 0.0%), Chilean (96.0%, a difference of 0.0%), Venezuelan (96.0%, a difference of 0.010%), and Immigrants from Korea (96.0%, a difference of 0.010%).
| Demographics | Rating | Rank | 7th Grade |
| Immigrants | Sri Lanka | 59.9 /100 | #167 | Average 96.1% |
| Immigrants | Poland | 59.0 /100 | #168 | Average 96.1% |
| Ute | 55.8 /100 | #169 | Average 96.1% |
| Immigrants | Ukraine | 55.0 /100 | #170 | Average 96.1% |
| Egyptians | 54.2 /100 | #171 | Average 96.1% |
| Venezuelans | 51.4 /100 | #172 | Average 96.0% |
| Immigrants | Albania | 50.4 /100 | #173 | Average 96.0% |
| Mongolians | 50.0 /100 | #174 | Average 96.0% |
| Blacks/African Americans | 49.5 /100 | #175 | Average 96.0% |
| Chileans | 49.3 /100 | #176 | Average 96.0% |
| Immigrants | Korea | 49.2 /100 | #177 | Average 96.0% |
| Marshallese | 48.4 /100 | #178 | Average 96.0% |
| Immigrants | Iran | 47.8 /100 | #179 | Average 96.0% |
| Immigrants | Brazil | 46.8 /100 | #180 | Average 96.0% |
| Pakistanis | 44.5 /100 | #181 | Average 96.0% |