Choctaw vs Immigrants from South Eastern Asia High School Diploma
COMPARE
Choctaw
Immigrants from South Eastern Asia
High School Diploma
High School Diploma Comparison
Choctaw
Immigrants from South Eastern Asia
87.8%
HIGH SCHOOL DIPLOMA
1.9/ 100
METRIC RATING
244th/ 347
METRIC RANK
87.2%
HIGH SCHOOL DIPLOMA
0.3/ 100
METRIC RATING
263rd/ 347
METRIC RANK
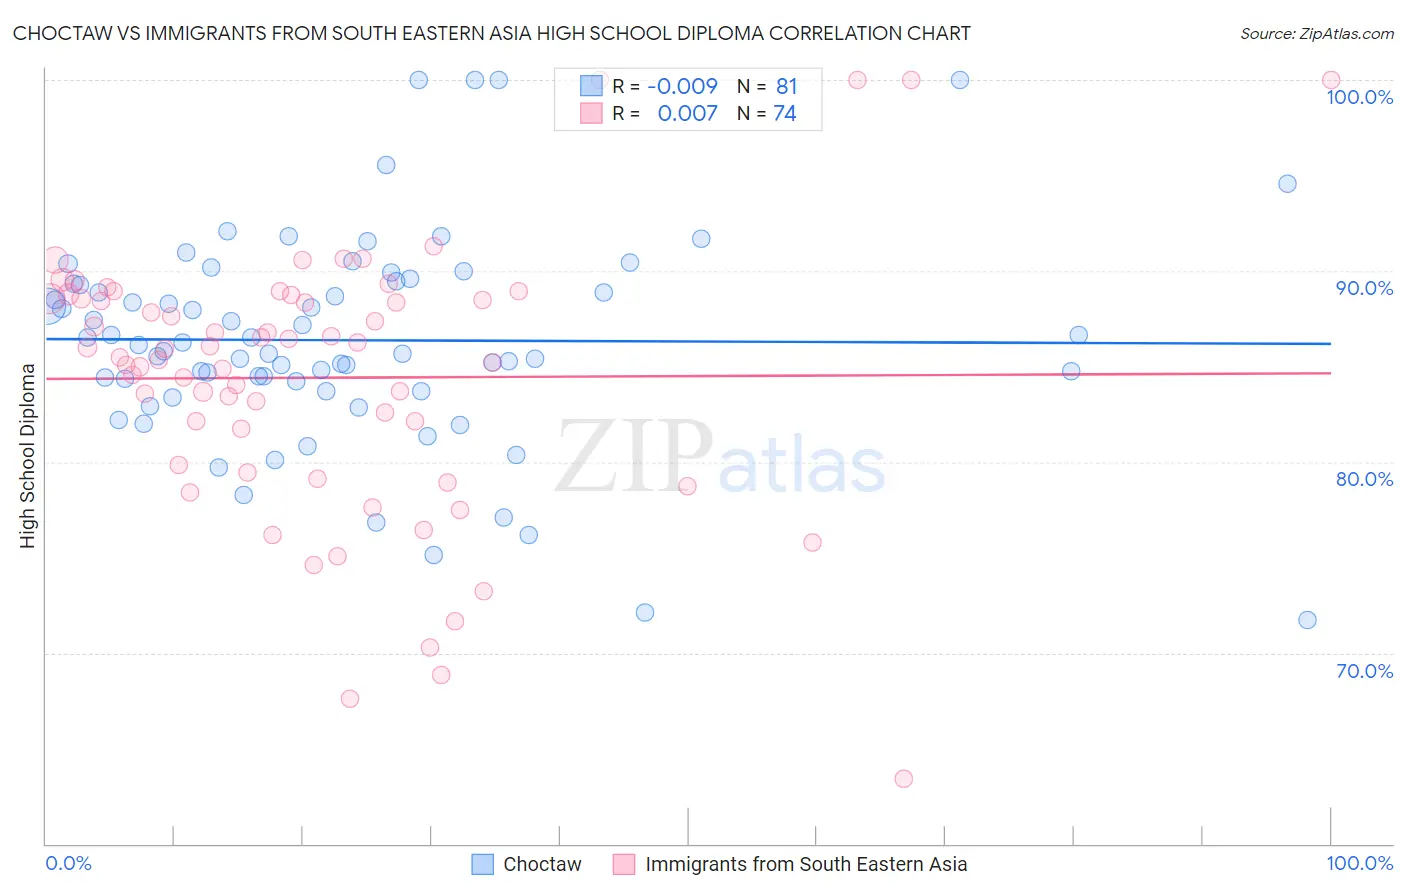
Choctaw vs Immigrants from South Eastern Asia High School Diploma Correlation Chart
The statistical analysis conducted on geographies consisting of 269,738,650 people shows no correlation between the proportion of Choctaw and percentage of population with at least high school diploma education in the United States with a correlation coefficient (R) of -0.009 and weighted average of 87.8%. Similarly, the statistical analysis conducted on geographies consisting of 512,708,901 people shows no correlation between the proportion of Immigrants from South Eastern Asia and percentage of population with at least high school diploma education in the United States with a correlation coefficient (R) of 0.007 and weighted average of 87.2%, a difference of 0.68%.
High School Diploma Correlation Summary
| Measurement | Choctaw | Immigrants from South Eastern Asia |
| Minimum | 71.7% | 63.4% |
| Maximum | 100.0% | 100.0% |
| Range | 28.3% | 36.6% |
| Mean | 86.4% | 84.4% |
| Median | 86.1% | 85.7% |
| Interquartile 25% (IQ1) | 84.0% | 79.9% |
| Interquartile 75% (IQ3) | 89.4% | 88.6% |
| Interquartile Range (IQR) | 5.4% | 8.7% |
| Standard Deviation (Sample) | 5.5% | 7.1% |
| Standard Deviation (Population) | 5.5% | 7.1% |
Demographics Similar to Choctaw and Immigrants from South Eastern Asia by High School Diploma
In terms of high school diploma, the demographic groups most similar to Choctaw are Immigrants from Philippines (87.8%, a difference of 0.0%), Peruvian (87.8%, a difference of 0.010%), Immigrants from Eritrea (87.8%, a difference of 0.040%), Immigrants from Costa Rica (87.8%, a difference of 0.050%), and Spanish American (87.7%, a difference of 0.090%). Similarly, the demographic groups most similar to Immigrants from South Eastern Asia are Immigrants from Peru (87.3%, a difference of 0.030%), Seminole (87.3%, a difference of 0.060%), Cajun (87.3%, a difference of 0.080%), Immigrants from Western Africa (87.4%, a difference of 0.16%), and Immigrants from Ghana (87.4%, a difference of 0.17%).
| Demographics | Rating | Rank | High School Diploma |
| Immigrants | Philippines | 1.9 /100 | #243 | Tragic 87.8% |
| Choctaw | 1.9 /100 | #244 | Tragic 87.8% |
| Peruvians | 1.9 /100 | #245 | Tragic 87.8% |
| Immigrants | Eritrea | 1.7 /100 | #246 | Tragic 87.8% |
| Immigrants | Costa Rica | 1.7 /100 | #247 | Tragic 87.8% |
| Spanish Americans | 1.5 /100 | #248 | Tragic 87.7% |
| Senegalese | 1.5 /100 | #249 | Tragic 87.7% |
| Immigrants | Nigeria | 1.5 /100 | #250 | Tragic 87.7% |
| Ghanaians | 1.4 /100 | #251 | Tragic 87.7% |
| Immigrants | South America | 1.2 /100 | #252 | Tragic 87.6% |
| Immigrants | Uruguay | 1.0 /100 | #253 | Tragic 87.6% |
| Immigrants | Colombia | 1.0 /100 | #254 | Tragic 87.6% |
| Immigrants | Senegal | 0.9 /100 | #255 | Tragic 87.6% |
| Africans | 0.7 /100 | #256 | Tragic 87.5% |
| Bahamians | 0.7 /100 | #257 | Tragic 87.5% |
| Immigrants | Ghana | 0.5 /100 | #258 | Tragic 87.4% |
| Immigrants | Western Africa | 0.5 /100 | #259 | Tragic 87.4% |
| Cajuns | 0.4 /100 | #260 | Tragic 87.3% |
| Seminole | 0.4 /100 | #261 | Tragic 87.3% |
| Immigrants | Peru | 0.4 /100 | #262 | Tragic 87.3% |
| Immigrants | South Eastern Asia | 0.3 /100 | #263 | Tragic 87.2% |