Choctaw vs Immigrants from Micronesia No Schooling Completed
COMPARE
Choctaw
Immigrants from Micronesia
No Schooling Completed
No Schooling Completed Comparison
Choctaw
Immigrants from Micronesia
1.8%
NO SCHOOLING COMPLETED
98.1/ 100
METRIC RATING
99th/ 347
METRIC RANK
2.1%
NO SCHOOLING COMPLETED
50.0/ 100
METRIC RATING
174th/ 347
METRIC RANK
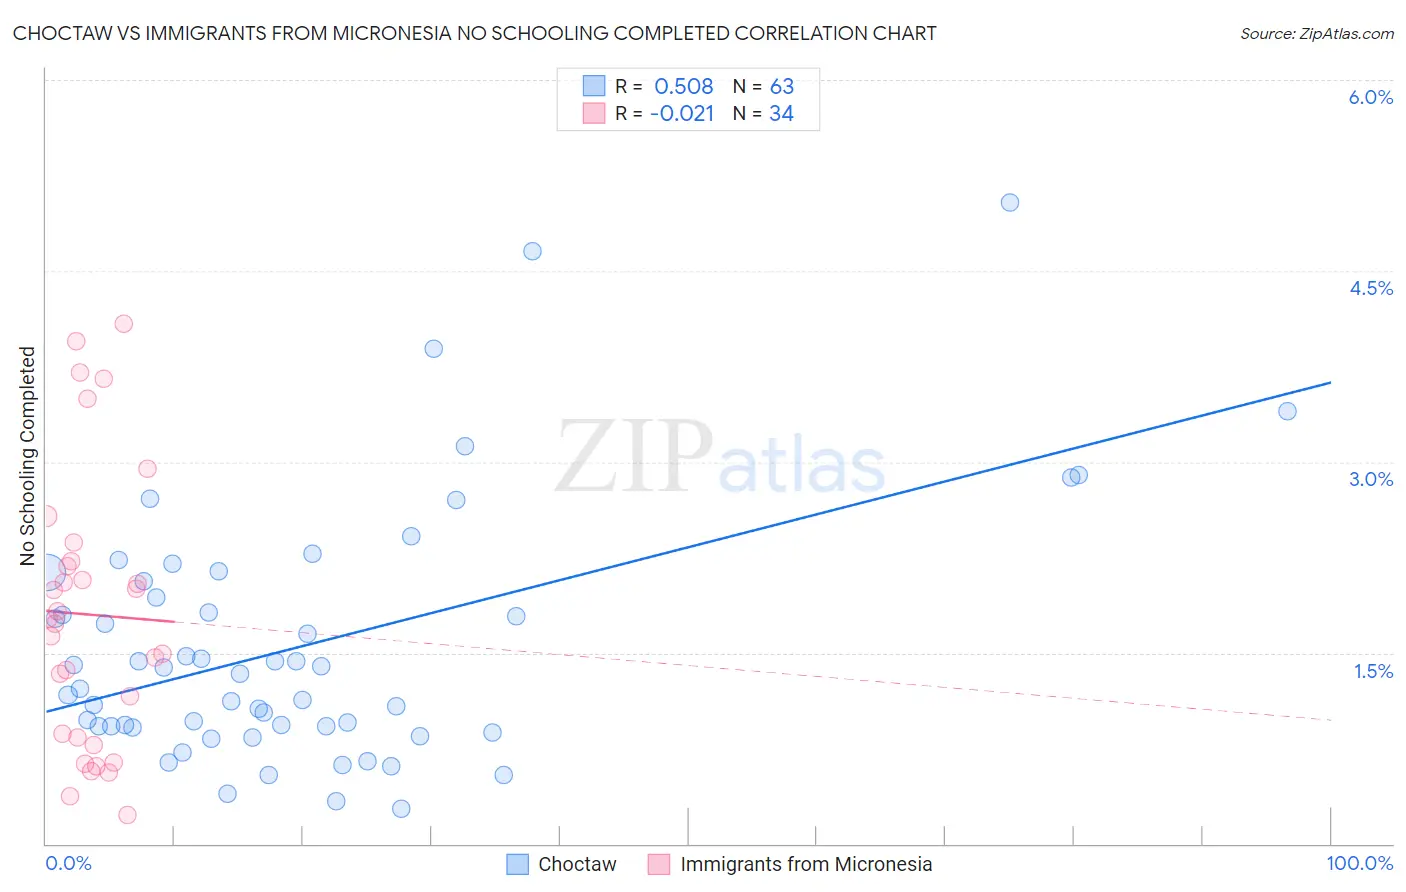
Choctaw vs Immigrants from Micronesia No Schooling Completed Correlation Chart
The statistical analysis conducted on geographies consisting of 267,452,860 people shows a substantial positive correlation between the proportion of Choctaw and percentage of population with no schooling in the United States with a correlation coefficient (R) of 0.508 and weighted average of 1.8%. Similarly, the statistical analysis conducted on geographies consisting of 61,387,395 people shows no correlation between the proportion of Immigrants from Micronesia and percentage of population with no schooling in the United States with a correlation coefficient (R) of -0.021 and weighted average of 2.1%, a difference of 15.4%.
No Schooling Completed Correlation Summary
| Measurement | Choctaw | Immigrants from Micronesia |
| Minimum | 0.27% | 0.23% |
| Maximum | 5.0% | 4.1% |
| Range | 4.8% | 3.9% |
| Mean | 1.6% | 1.8% |
| Median | 1.3% | 1.7% |
| Interquartile 25% (IQ1) | 0.92% | 0.84% |
| Interquartile 75% (IQ3) | 2.1% | 2.2% |
| Interquartile Range (IQR) | 1.1% | 1.4% |
| Standard Deviation (Sample) | 0.99% | 1.1% |
| Standard Deviation (Population) | 0.98% | 1.1% |
Similar Demographics by No Schooling Completed
Demographics Similar to Choctaw by No Schooling Completed
In terms of no schooling completed, the demographic groups most similar to Choctaw are Iranian (1.8%, a difference of 0.19%), Immigrants from Singapore (1.8%, a difference of 0.20%), Immigrants from Ireland (1.8%, a difference of 0.47%), Immigrants from Czechoslovakia (1.8%, a difference of 0.49%), and Immigrants from Switzerland (1.8%, a difference of 0.50%).
| Demographics | Rating | Rank | No Schooling Completed |
| Romanians | 98.8 /100 | #92 | Exceptional 1.8% |
| Turks | 98.7 /100 | #93 | Exceptional 1.8% |
| Immigrants | Nonimmigrants | 98.5 /100 | #94 | Exceptional 1.8% |
| Puget Sound Salish | 98.5 /100 | #95 | Exceptional 1.8% |
| Bhutanese | 98.4 /100 | #96 | Exceptional 1.8% |
| Immigrants | Ireland | 98.4 /100 | #97 | Exceptional 1.8% |
| Iranians | 98.2 /100 | #98 | Exceptional 1.8% |
| Choctaw | 98.1 /100 | #99 | Exceptional 1.8% |
| Immigrants | Singapore | 98.0 /100 | #100 | Exceptional 1.8% |
| Immigrants | Czechoslovakia | 97.9 /100 | #101 | Exceptional 1.8% |
| Immigrants | Switzerland | 97.9 /100 | #102 | Exceptional 1.8% |
| Basques | 97.9 /100 | #103 | Exceptional 1.8% |
| Thais | 97.5 /100 | #104 | Exceptional 1.8% |
| German Russians | 97.5 /100 | #105 | Exceptional 1.8% |
| Immigrants | France | 97.3 /100 | #106 | Exceptional 1.8% |
Demographics Similar to Immigrants from Micronesia by No Schooling Completed
In terms of no schooling completed, the demographic groups most similar to Immigrants from Micronesia are Immigrants from Belarus (2.1%, a difference of 0.24%), Immigrants from Argentina (2.1%, a difference of 0.37%), Arab (2.1%, a difference of 0.48%), Panamanian (2.1%, a difference of 0.65%), and Arapaho (2.1%, a difference of 0.67%).
| Demographics | Rating | Rank | No Schooling Completed |
| Egyptians | 59.2 /100 | #167 | Average 2.1% |
| Cheyenne | 58.6 /100 | #168 | Average 2.1% |
| Apache | 56.7 /100 | #169 | Average 2.1% |
| Argentineans | 56.0 /100 | #170 | Average 2.1% |
| Immigrants | Poland | 55.2 /100 | #171 | Average 2.1% |
| Immigrants | Argentina | 52.7 /100 | #172 | Average 2.1% |
| Immigrants | Belarus | 51.8 /100 | #173 | Average 2.1% |
| Immigrants | Micronesia | 50.0 /100 | #174 | Average 2.1% |
| Arabs | 46.4 /100 | #175 | Average 2.1% |
| Panamanians | 45.2 /100 | #176 | Average 2.1% |
| Arapaho | 45.0 /100 | #177 | Average 2.1% |
| Pakistanis | 44.7 /100 | #178 | Average 2.1% |
| Immigrants | Kazakhstan | 44.3 /100 | #179 | Average 2.1% |
| Portuguese | 43.9 /100 | #180 | Average 2.1% |
| Immigrants | Taiwan | 42.6 /100 | #181 | Average 2.1% |