Choctaw vs Argentinean College, 1 year or more
COMPARE
Choctaw
Argentinean
College, 1 year or more
College, 1 year or more Comparison
Choctaw
Argentineans
52.3%
COLLEGE, 1 YEAR OR MORE
0.0/ 100
METRIC RATING
300th/ 347
METRIC RANK
63.2%
COLLEGE, 1 YEAR OR MORE
99.2/ 100
METRIC RATING
70th/ 347
METRIC RANK
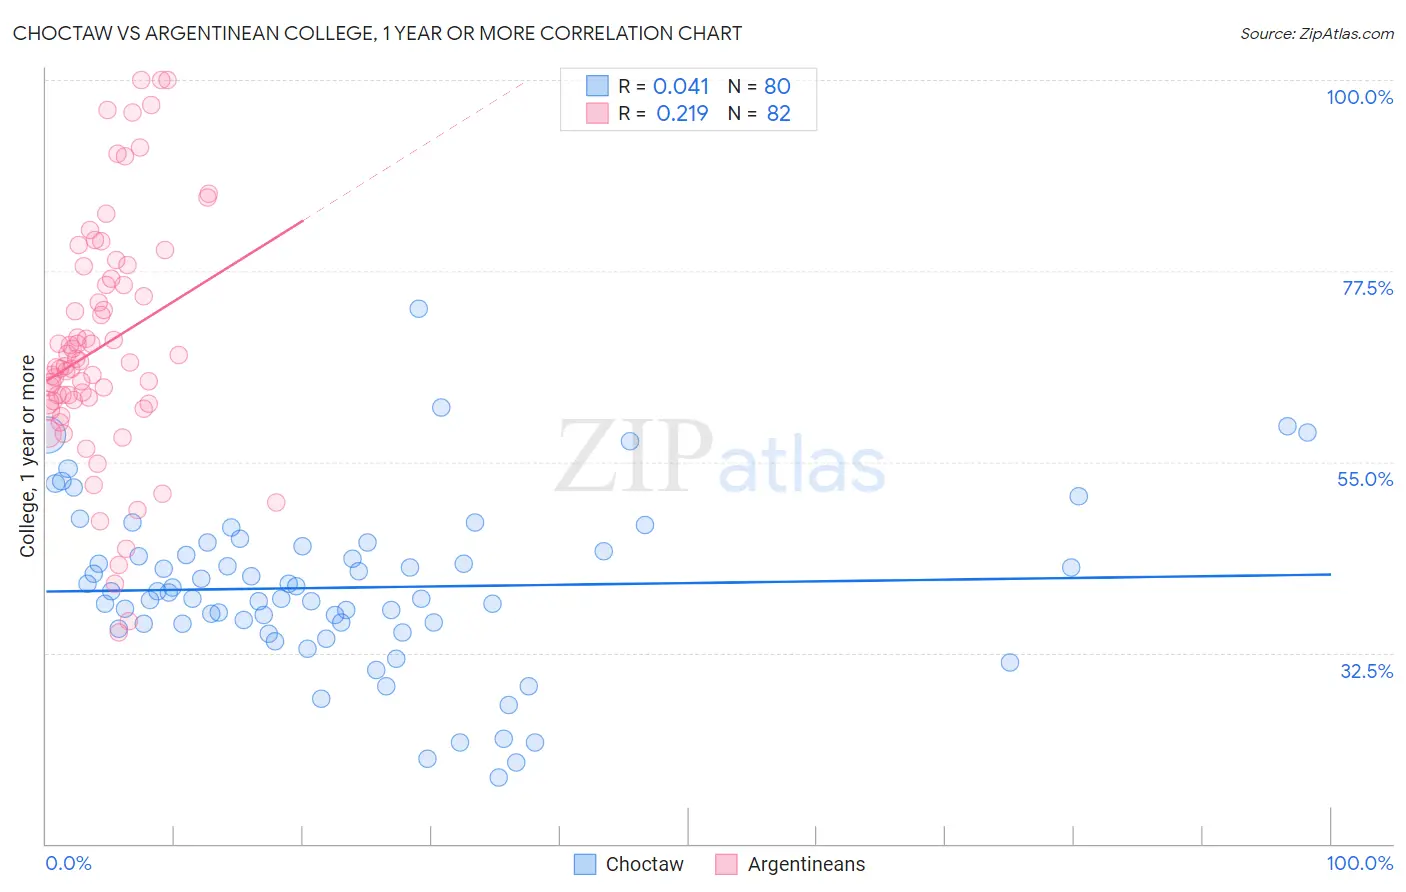
Choctaw vs Argentinean College, 1 year or more Correlation Chart
The statistical analysis conducted on geographies consisting of 269,741,564 people shows no correlation between the proportion of Choctaw and percentage of population with at least college, 1 year or more education in the United States with a correlation coefficient (R) of 0.041 and weighted average of 52.3%. Similarly, the statistical analysis conducted on geographies consisting of 297,139,739 people shows a weak positive correlation between the proportion of Argentineans and percentage of population with at least college, 1 year or more education in the United States with a correlation coefficient (R) of 0.219 and weighted average of 63.2%, a difference of 20.8%.
College, 1 year or more Correlation Summary
| Measurement | Choctaw | Argentinean |
| Minimum | 17.8% | 34.8% |
| Maximum | 73.1% | 100.0% |
| Range | 55.3% | 65.2% |
| Mean | 40.2% | 68.7% |
| Median | 39.7% | 66.5% |
| Interquartile 25% (IQ1) | 35.9% | 62.0% |
| Interquartile 75% (IQ3) | 44.7% | 76.5% |
| Interquartile Range (IQR) | 8.8% | 14.6% |
| Standard Deviation (Sample) | 9.9% | 14.2% |
| Standard Deviation (Population) | 9.8% | 14.2% |
Similar Demographics by College, 1 year or more
Demographics Similar to Choctaw by College, 1 year or more
In terms of college, 1 year or more, the demographic groups most similar to Choctaw are Immigrants from Nicaragua (52.4%, a difference of 0.040%), Haitian (52.3%, a difference of 0.060%), Puerto Rican (52.2%, a difference of 0.19%), Creek (52.2%, a difference of 0.26%), and Immigrants from Dominica (52.5%, a difference of 0.38%).
| Demographics | Rating | Rank | College, 1 year or more |
| Blacks/African Americans | 0.0 /100 | #293 | Tragic 53.3% |
| Cherokee | 0.0 /100 | #294 | Tragic 53.2% |
| Yaqui | 0.0 /100 | #295 | Tragic 53.2% |
| Sioux | 0.0 /100 | #296 | Tragic 53.0% |
| Paiute | 0.0 /100 | #297 | Tragic 52.9% |
| Immigrants | Dominica | 0.0 /100 | #298 | Tragic 52.5% |
| Immigrants | Nicaragua | 0.0 /100 | #299 | Tragic 52.4% |
| Choctaw | 0.0 /100 | #300 | Tragic 52.3% |
| Haitians | 0.0 /100 | #301 | Tragic 52.3% |
| Puerto Ricans | 0.0 /100 | #302 | Tragic 52.2% |
| Creek | 0.0 /100 | #303 | Tragic 52.2% |
| Central Americans | 0.0 /100 | #304 | Tragic 52.1% |
| Seminole | 0.0 /100 | #305 | Tragic 52.1% |
| Mexican American Indians | 0.0 /100 | #306 | Tragic 51.9% |
| Immigrants | Portugal | 0.0 /100 | #307 | Tragic 51.9% |
Demographics Similar to Argentineans by College, 1 year or more
In terms of college, 1 year or more, the demographic groups most similar to Argentineans are Immigrants from Greece (63.3%, a difference of 0.10%), Immigrants from Zimbabwe (63.3%, a difference of 0.10%), Immigrants from Romania (63.3%, a difference of 0.12%), Immigrants from Europe (63.3%, a difference of 0.13%), and Immigrants from Canada (63.1%, a difference of 0.18%).
| Demographics | Rating | Rank | College, 1 year or more |
| Immigrants | Scotland | 99.4 /100 | #63 | Exceptional 63.4% |
| Immigrants | Spain | 99.4 /100 | #64 | Exceptional 63.4% |
| Maltese | 99.3 /100 | #65 | Exceptional 63.4% |
| Immigrants | Europe | 99.3 /100 | #66 | Exceptional 63.3% |
| Immigrants | Romania | 99.3 /100 | #67 | Exceptional 63.3% |
| Immigrants | Greece | 99.3 /100 | #68 | Exceptional 63.3% |
| Immigrants | Zimbabwe | 99.3 /100 | #69 | Exceptional 63.3% |
| Argentineans | 99.2 /100 | #70 | Exceptional 63.2% |
| Immigrants | Canada | 99.1 /100 | #71 | Exceptional 63.1% |
| Egyptians | 99.0 /100 | #72 | Exceptional 63.1% |
| Immigrants | Moldova | 99.0 /100 | #73 | Exceptional 63.0% |
| Immigrants | North America | 99.0 /100 | #74 | Exceptional 63.0% |
| Armenians | 98.9 /100 | #75 | Exceptional 63.0% |
| Paraguayans | 98.8 /100 | #76 | Exceptional 62.9% |
| Ethiopians | 98.8 /100 | #77 | Exceptional 62.9% |