Chippewa vs Immigrants from Syria 8th Grade
COMPARE
Chippewa
Immigrants from Syria
8th Grade
8th Grade Comparison
Chippewa
Immigrants from Syria
97.1%
8TH GRADE
100.0/ 100
METRIC RATING
31st/ 347
METRIC RANK
95.3%
8TH GRADE
7.4/ 100
METRIC RATING
221st/ 347
METRIC RANK
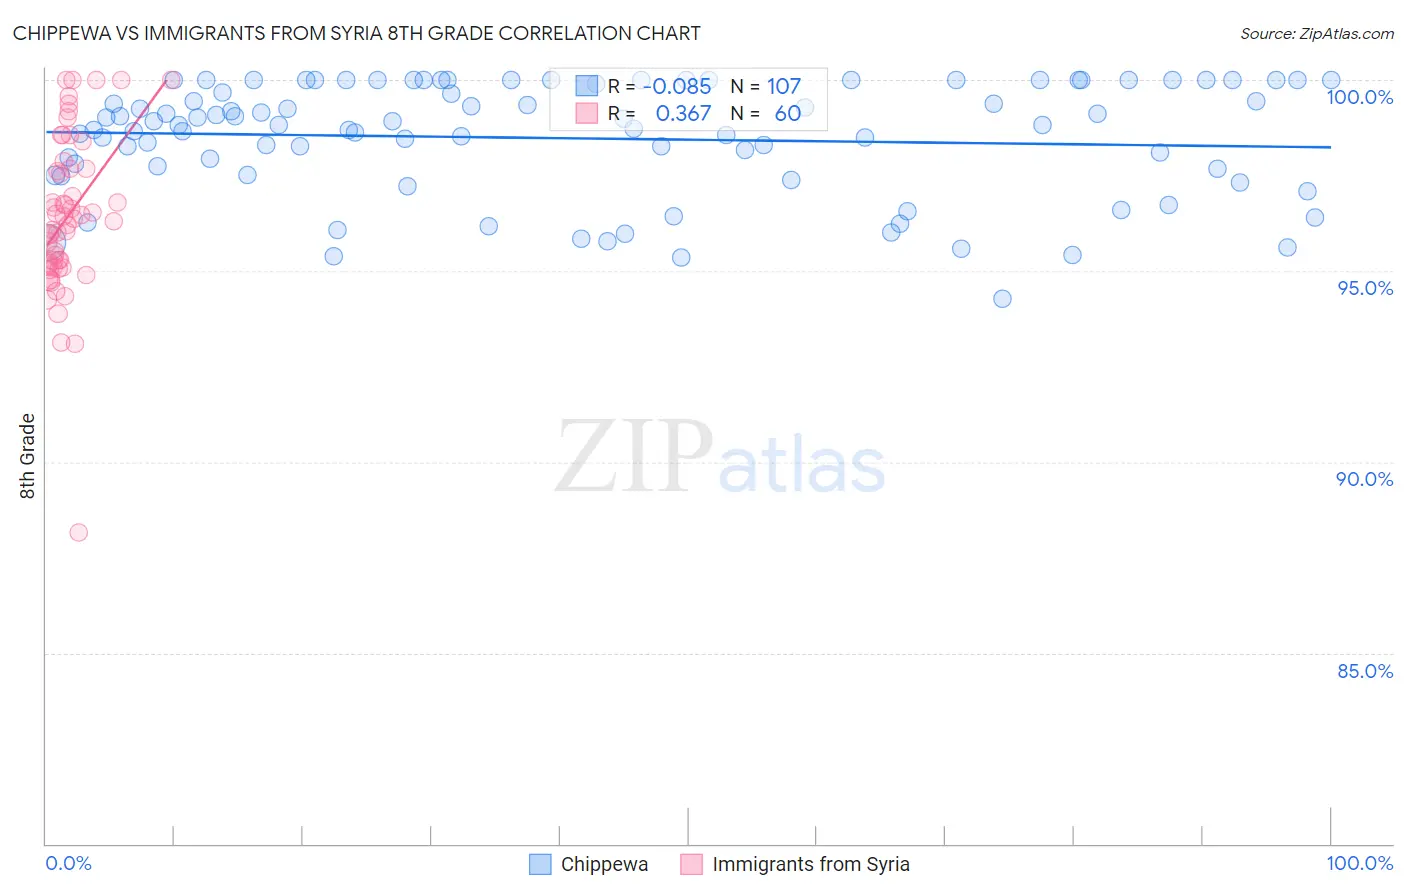
Chippewa vs Immigrants from Syria 8th Grade Correlation Chart
The statistical analysis conducted on geographies consisting of 215,065,863 people shows a slight negative correlation between the proportion of Chippewa and percentage of population with at least 8th grade education in the United States with a correlation coefficient (R) of -0.085 and weighted average of 97.1%. Similarly, the statistical analysis conducted on geographies consisting of 174,108,374 people shows a mild positive correlation between the proportion of Immigrants from Syria and percentage of population with at least 8th grade education in the United States with a correlation coefficient (R) of 0.367 and weighted average of 95.3%, a difference of 1.8%.
8th Grade Correlation Summary
| Measurement | Chippewa | Immigrants from Syria |
| Minimum | 94.3% | 88.1% |
| Maximum | 100.0% | 100.0% |
| Range | 5.7% | 11.9% |
| Mean | 98.5% | 96.4% |
| Median | 98.8% | 96.3% |
| Interquartile 25% (IQ1) | 97.5% | 95.1% |
| Interquartile 75% (IQ3) | 100.0% | 97.7% |
| Interquartile Range (IQR) | 2.5% | 2.5% |
| Standard Deviation (Sample) | 1.5% | 2.1% |
| Standard Deviation (Population) | 1.5% | 2.1% |
Similar Demographics by 8th Grade
Demographics Similar to Chippewa by 8th Grade
In terms of 8th grade, the demographic groups most similar to Chippewa are Sioux (97.1%, a difference of 0.0%), Italian (97.1%, a difference of 0.030%), European (97.1%, a difference of 0.030%), Yup'ik (97.0%, a difference of 0.030%), and Swiss (97.0%, a difference of 0.040%).
| Demographics | Rating | Rank | 8th Grade |
| Scandinavians | 100.0 /100 | #24 | Exceptional 97.2% |
| Czechs | 100.0 /100 | #25 | Exceptional 97.1% |
| French | 100.0 /100 | #26 | Exceptional 97.1% |
| Scotch-Irish | 100.0 /100 | #27 | Exceptional 97.1% |
| Italians | 100.0 /100 | #28 | Exceptional 97.1% |
| Europeans | 100.0 /100 | #29 | Exceptional 97.1% |
| Sioux | 100.0 /100 | #30 | Exceptional 97.1% |
| Chippewa | 100.0 /100 | #31 | Exceptional 97.1% |
| Yup'ik | 100.0 /100 | #32 | Exceptional 97.0% |
| Swiss | 100.0 /100 | #33 | Exceptional 97.0% |
| Luxembourgers | 100.0 /100 | #34 | Exceptional 97.0% |
| Alaska Natives | 100.0 /100 | #35 | Exceptional 97.0% |
| Belgians | 100.0 /100 | #36 | Exceptional 97.0% |
| Latvians | 100.0 /100 | #37 | Exceptional 97.0% |
| British | 100.0 /100 | #38 | Exceptional 97.0% |
Demographics Similar to Immigrants from Syria by 8th Grade
In terms of 8th grade, the demographic groups most similar to Immigrants from Syria are Immigrants from Malaysia (95.3%, a difference of 0.0%), Dutch West Indian (95.4%, a difference of 0.010%), Spanish American (95.4%, a difference of 0.010%), Immigrants from Southern Europe (95.3%, a difference of 0.010%), and Immigrants from Oceania (95.3%, a difference of 0.010%).
| Demographics | Rating | Rank | 8th Grade |
| Immigrants | Chile | 9.0 /100 | #214 | Tragic 95.4% |
| Immigrants | Liberia | 8.9 /100 | #215 | Tragic 95.4% |
| Samoans | 8.4 /100 | #216 | Tragic 95.4% |
| Immigrants | Eastern Asia | 8.3 /100 | #217 | Tragic 95.4% |
| Dutch West Indians | 8.1 /100 | #218 | Tragic 95.4% |
| Spanish Americans | 8.0 /100 | #219 | Tragic 95.4% |
| Immigrants | Southern Europe | 7.7 /100 | #220 | Tragic 95.3% |
| Immigrants | Syria | 7.4 /100 | #221 | Tragic 95.3% |
| Immigrants | Malaysia | 7.3 /100 | #222 | Tragic 95.3% |
| Immigrants | Oceania | 7.1 /100 | #223 | Tragic 95.3% |
| Immigrants | Western Asia | 6.0 /100 | #224 | Tragic 95.3% |
| Sub-Saharan Africans | 6.0 /100 | #225 | Tragic 95.3% |
| Navajo | 5.7 /100 | #226 | Tragic 95.3% |
| Bahamians | 5.6 /100 | #227 | Tragic 95.3% |
| Immigrants | Eastern Africa | 5.6 /100 | #228 | Tragic 95.3% |