Chippewa vs Immigrants from Syria 10th Grade
COMPARE
Chippewa
Immigrants from Syria
10th Grade
10th Grade Comparison
Chippewa
Immigrants from Syria
95.0%
10TH GRADE
99.8/ 100
METRIC RATING
61st/ 347
METRIC RANK
93.4%
10TH GRADE
19.4/ 100
METRIC RATING
208th/ 347
METRIC RANK
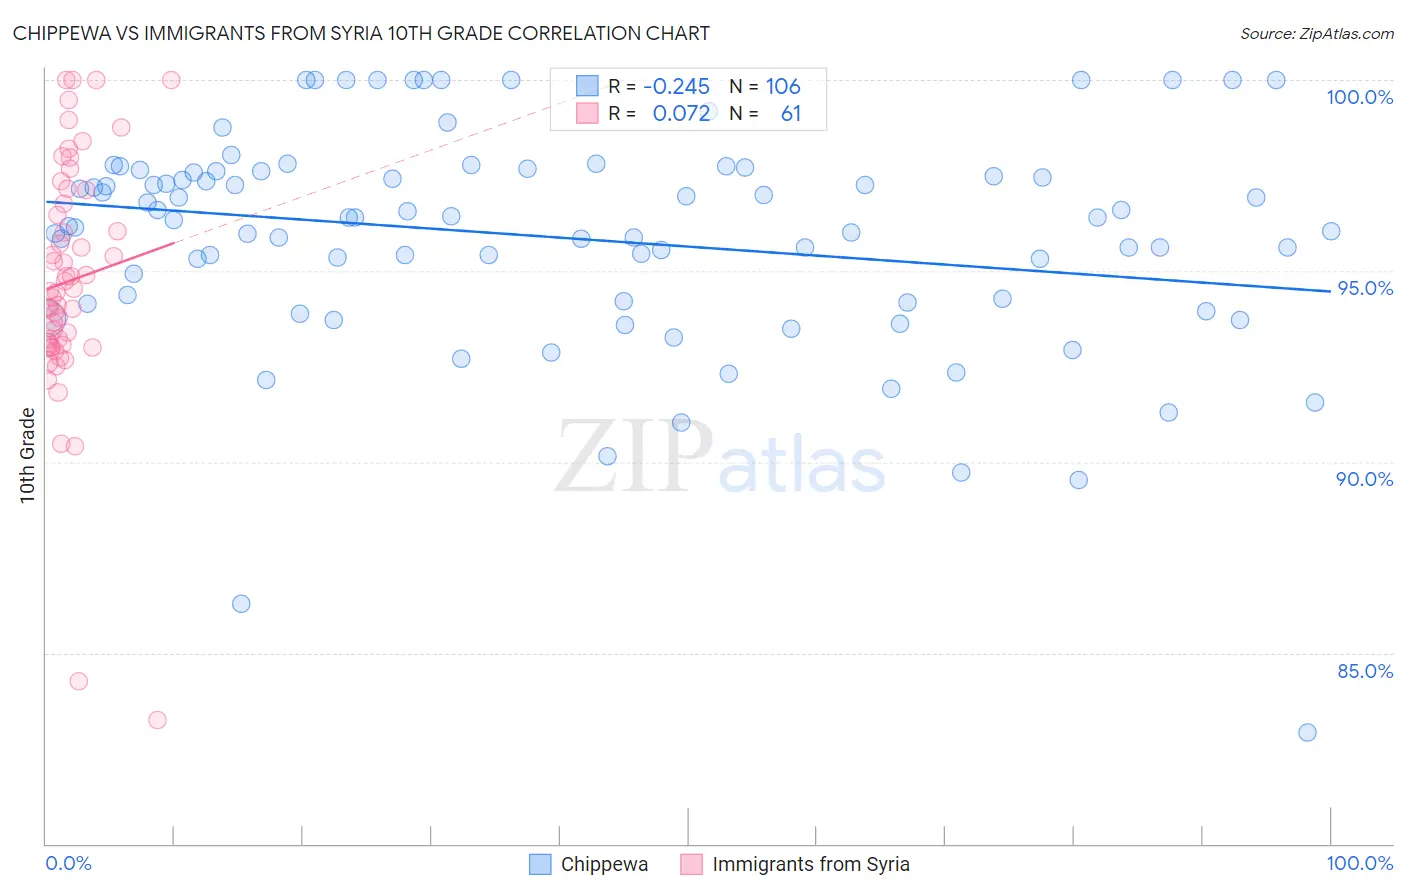
Chippewa vs Immigrants from Syria 10th Grade Correlation Chart
The statistical analysis conducted on geographies consisting of 215,067,289 people shows a weak negative correlation between the proportion of Chippewa and percentage of population with at least 10th grade education in the United States with a correlation coefficient (R) of -0.245 and weighted average of 95.0%. Similarly, the statistical analysis conducted on geographies consisting of 174,108,882 people shows a slight positive correlation between the proportion of Immigrants from Syria and percentage of population with at least 10th grade education in the United States with a correlation coefficient (R) of 0.072 and weighted average of 93.4%, a difference of 1.7%.
10th Grade Correlation Summary
| Measurement | Chippewa | Immigrants from Syria |
| Minimum | 82.9% | 83.2% |
| Maximum | 100.0% | 100.0% |
| Range | 17.1% | 16.8% |
| Mean | 95.9% | 94.7% |
| Median | 96.4% | 94.5% |
| Interquartile 25% (IQ1) | 94.2% | 93.1% |
| Interquartile 75% (IQ3) | 97.6% | 96.9% |
| Interquartile Range (IQR) | 3.4% | 3.9% |
| Standard Deviation (Sample) | 2.9% | 3.2% |
| Standard Deviation (Population) | 2.9% | 3.1% |
Similar Demographics by 10th Grade
Demographics Similar to Chippewa by 10th Grade
In terms of 10th grade, the demographic groups most similar to Chippewa are Cypriot (95.0%, a difference of 0.0%), Aleut (95.0%, a difference of 0.010%), Celtic (95.0%, a difference of 0.010%), Thai (95.0%, a difference of 0.010%), and Immigrants from Singapore (95.0%, a difference of 0.010%).
| Demographics | Rating | Rank | 10th Grade |
| Immigrants | Lithuania | 99.8 /100 | #54 | Exceptional 95.0% |
| Immigrants | Ireland | 99.8 /100 | #55 | Exceptional 95.0% |
| New Zealanders | 99.8 /100 | #56 | Exceptional 95.0% |
| Ukrainians | 99.8 /100 | #57 | Exceptional 95.0% |
| Aleuts | 99.8 /100 | #58 | Exceptional 95.0% |
| Celtics | 99.8 /100 | #59 | Exceptional 95.0% |
| Cypriots | 99.8 /100 | #60 | Exceptional 95.0% |
| Chippewa | 99.8 /100 | #61 | Exceptional 95.0% |
| Thais | 99.8 /100 | #62 | Exceptional 95.0% |
| Immigrants | Singapore | 99.8 /100 | #63 | Exceptional 95.0% |
| Native Hawaiians | 99.7 /100 | #64 | Exceptional 95.0% |
| Turks | 99.7 /100 | #65 | Exceptional 95.0% |
| Immigrants | Australia | 99.7 /100 | #66 | Exceptional 94.9% |
| Immigrants | Netherlands | 99.7 /100 | #67 | Exceptional 94.9% |
| Immigrants | Belgium | 99.7 /100 | #68 | Exceptional 94.9% |
Demographics Similar to Immigrants from Syria by 10th Grade
In terms of 10th grade, the demographic groups most similar to Immigrants from Syria are Samoan (93.4%, a difference of 0.0%), Ute (93.4%, a difference of 0.010%), Immigrants from Indonesia (93.4%, a difference of 0.010%), Immigrants from Sudan (93.4%, a difference of 0.010%), and Immigrants from Chile (93.4%, a difference of 0.010%).
| Demographics | Rating | Rank | 10th Grade |
| Hawaiians | 21.8 /100 | #201 | Fair 93.5% |
| Immigrants | Uganda | 20.9 /100 | #202 | Fair 93.5% |
| Immigrants | Western Asia | 20.6 /100 | #203 | Fair 93.4% |
| Ute | 20.3 /100 | #204 | Fair 93.4% |
| Immigrants | Indonesia | 20.2 /100 | #205 | Fair 93.4% |
| Immigrants | Sudan | 20.0 /100 | #206 | Fair 93.4% |
| Samoans | 19.5 /100 | #207 | Poor 93.4% |
| Immigrants | Syria | 19.4 /100 | #208 | Poor 93.4% |
| Immigrants | Chile | 18.8 /100 | #209 | Poor 93.4% |
| Indians (Asian) | 17.6 /100 | #210 | Poor 93.4% |
| Cajuns | 16.9 /100 | #211 | Poor 93.4% |
| Immigrants | Zaire | 16.7 /100 | #212 | Poor 93.4% |
| Immigrants | Asia | 15.7 /100 | #213 | Poor 93.4% |
| Immigrants | Bahamas | 15.2 /100 | #214 | Poor 93.4% |
| Immigrants | Oceania | 15.1 /100 | #215 | Poor 93.4% |