Chippewa vs Immigrants from Pakistan 11th Grade
COMPARE
Chippewa
Immigrants from Pakistan
11th Grade
11th Grade Comparison
Chippewa
Immigrants from Pakistan
93.5%
11TH GRADE
98.6/ 100
METRIC RATING
102nd/ 347
METRIC RANK
92.5%
11TH GRADE
52.3/ 100
METRIC RATING
172nd/ 347
METRIC RANK
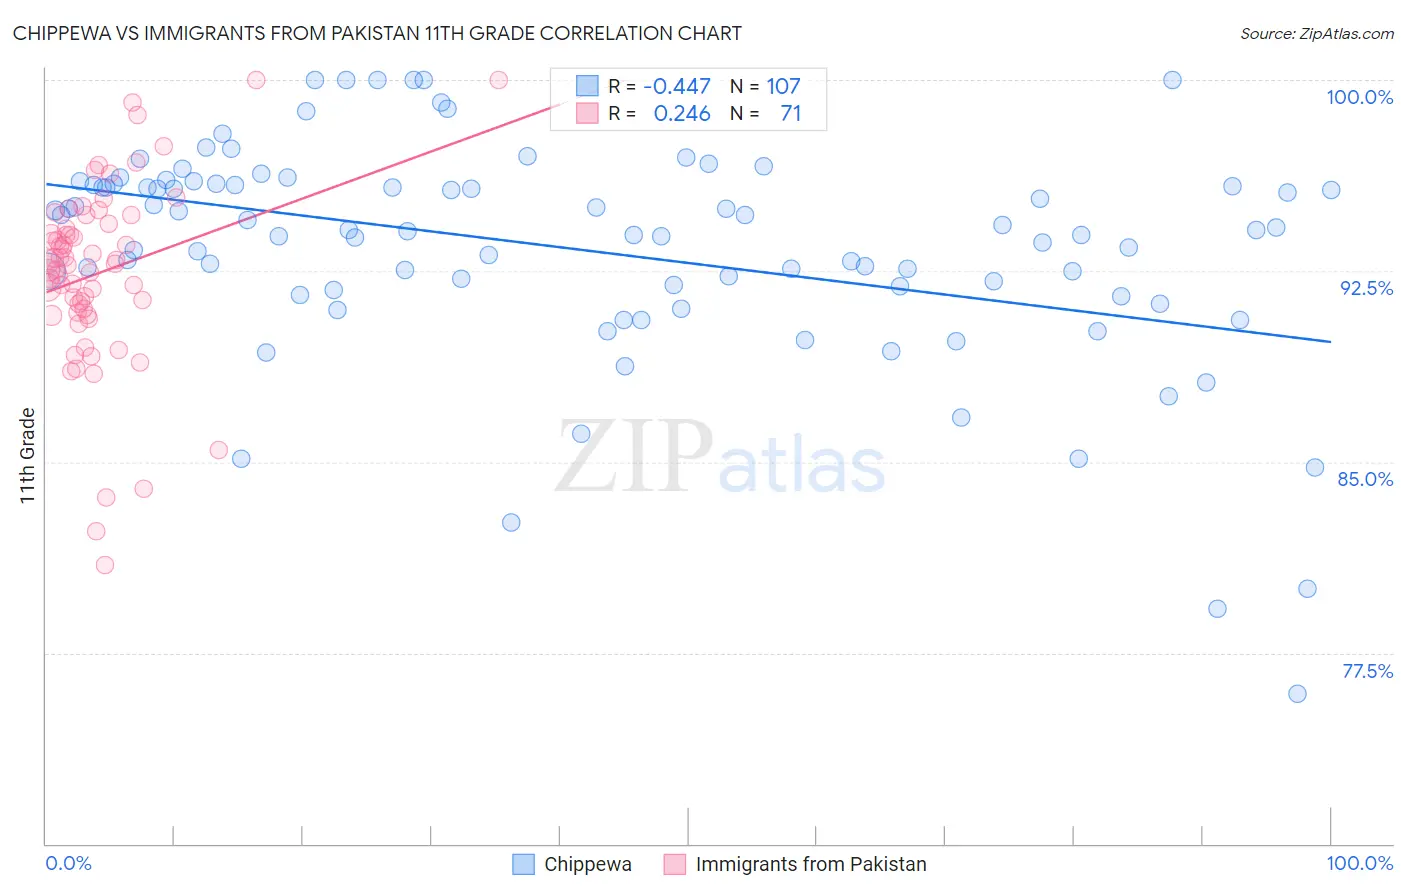
Chippewa vs Immigrants from Pakistan 11th Grade Correlation Chart
The statistical analysis conducted on geographies consisting of 215,068,316 people shows a moderate negative correlation between the proportion of Chippewa and percentage of population with at least 11th grade education in the United States with a correlation coefficient (R) of -0.447 and weighted average of 93.5%. Similarly, the statistical analysis conducted on geographies consisting of 283,836,095 people shows a weak positive correlation between the proportion of Immigrants from Pakistan and percentage of population with at least 11th grade education in the United States with a correlation coefficient (R) of 0.246 and weighted average of 92.5%, a difference of 1.0%.
11th Grade Correlation Summary
| Measurement | Chippewa | Immigrants from Pakistan |
| Minimum | 75.9% | 81.0% |
| Maximum | 100.0% | 100.0% |
| Range | 24.1% | 19.0% |
| Mean | 93.4% | 92.4% |
| Median | 94.1% | 92.8% |
| Interquartile 25% (IQ1) | 91.8% | 90.9% |
| Interquartile 75% (IQ3) | 95.9% | 94.4% |
| Interquartile Range (IQR) | 4.1% | 3.5% |
| Standard Deviation (Sample) | 4.3% | 3.6% |
| Standard Deviation (Population) | 4.3% | 3.6% |
Similar Demographics by 11th Grade
Demographics Similar to Chippewa by 11th Grade
In terms of 11th grade, the demographic groups most similar to Chippewa are Lebanese (93.5%, a difference of 0.0%), Immigrants from Europe (93.5%, a difference of 0.0%), Immigrants from Serbia (93.5%, a difference of 0.0%), Immigrants from Romania (93.5%, a difference of 0.010%), and Immigrants from Croatia (93.5%, a difference of 0.010%).
| Demographics | Rating | Rank | 11th Grade |
| Immigrants | France | 99.0 /100 | #95 | Exceptional 93.6% |
| Immigrants | Turkey | 98.9 /100 | #96 | Exceptional 93.5% |
| Immigrants | Iran | 98.9 /100 | #97 | Exceptional 93.5% |
| Immigrants | Israel | 98.8 /100 | #98 | Exceptional 93.5% |
| Menominee | 98.7 /100 | #99 | Exceptional 93.5% |
| Immigrants | North Macedonia | 98.7 /100 | #100 | Exceptional 93.5% |
| Immigrants | Romania | 98.7 /100 | #101 | Exceptional 93.5% |
| Chippewa | 98.6 /100 | #102 | Exceptional 93.5% |
| Lebanese | 98.6 /100 | #103 | Exceptional 93.5% |
| Immigrants | Europe | 98.6 /100 | #104 | Exceptional 93.5% |
| Immigrants | Serbia | 98.6 /100 | #105 | Exceptional 93.5% |
| Immigrants | Croatia | 98.6 /100 | #106 | Exceptional 93.5% |
| Immigrants | Norway | 98.4 /100 | #107 | Exceptional 93.5% |
| Alaska Natives | 98.4 /100 | #108 | Exceptional 93.5% |
| Immigrants | Kuwait | 98.4 /100 | #109 | Exceptional 93.5% |
Demographics Similar to Immigrants from Pakistan by 11th Grade
In terms of 11th grade, the demographic groups most similar to Immigrants from Pakistan are Indian (Asian) (92.5%, a difference of 0.010%), Laotian (92.6%, a difference of 0.020%), Asian (92.5%, a difference of 0.020%), Shoshone (92.5%, a difference of 0.030%), and Immigrants from Albania (92.6%, a difference of 0.050%).
| Demographics | Rating | Rank | 11th Grade |
| Immigrants | Iraq | 63.7 /100 | #165 | Good 92.6% |
| Bermudans | 62.3 /100 | #166 | Good 92.6% |
| Alsatians | 60.2 /100 | #167 | Good 92.6% |
| Sierra Leoneans | 58.7 /100 | #168 | Average 92.6% |
| Immigrants | Albania | 57.8 /100 | #169 | Average 92.6% |
| Immigrants | Northern Africa | 57.3 /100 | #170 | Average 92.6% |
| Laotians | 54.4 /100 | #171 | Average 92.6% |
| Immigrants | Pakistan | 52.3 /100 | #172 | Average 92.5% |
| Indians (Asian) | 51.5 /100 | #173 | Average 92.5% |
| Asians | 50.0 /100 | #174 | Average 92.5% |
| Shoshone | 48.9 /100 | #175 | Average 92.5% |
| Spaniards | 46.9 /100 | #176 | Average 92.5% |
| Guamanians/Chamorros | 45.0 /100 | #177 | Average 92.5% |
| Sudanese | 43.4 /100 | #178 | Average 92.5% |
| Creek | 40.9 /100 | #179 | Average 92.4% |