Basque vs Immigrants from Armenia Associate's Degree
COMPARE
Basque
Immigrants from Armenia
Associate's Degree
Associate's Degree Comparison
Basques
Immigrants from Armenia
46.5%
ASSOCIATE'S DEGREE
52.8/ 100
METRIC RATING
171st/ 347
METRIC RANK
47.4%
ASSOCIATE'S DEGREE
76.6/ 100
METRIC RATING
149th/ 347
METRIC RANK
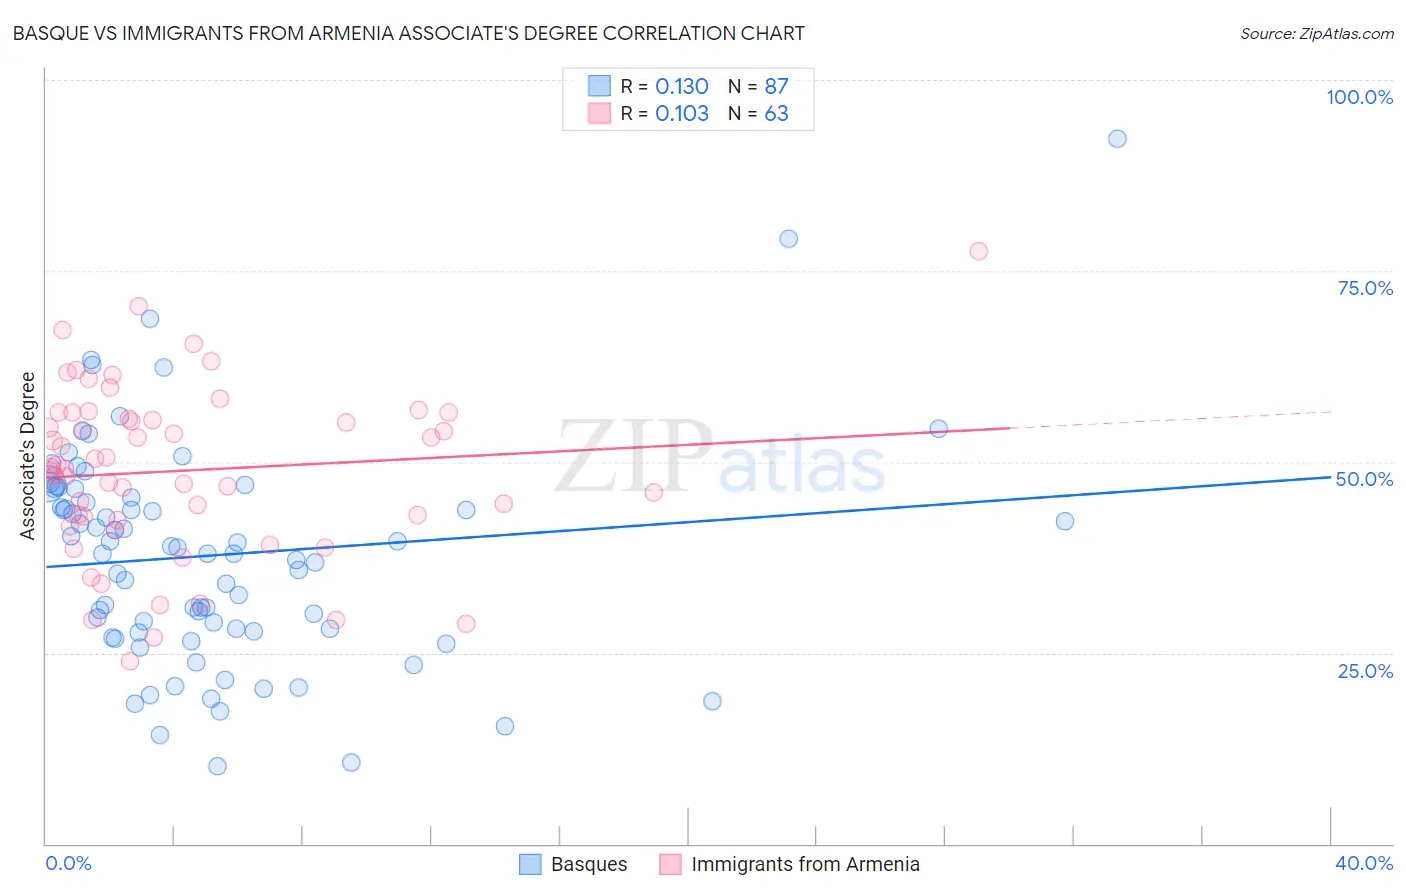
Basque vs Immigrants from Armenia Associate's Degree Correlation Chart
The statistical analysis conducted on geographies consisting of 165,778,580 people shows a poor positive correlation between the proportion of Basques and percentage of population with at least associate's degree education in the United States with a correlation coefficient (R) of 0.130 and weighted average of 46.5%. Similarly, the statistical analysis conducted on geographies consisting of 97,722,982 people shows a poor positive correlation between the proportion of Immigrants from Armenia and percentage of population with at least associate's degree education in the United States with a correlation coefficient (R) of 0.103 and weighted average of 47.4%, a difference of 2.0%.
Associate's Degree Correlation Summary
| Measurement | Basque | Immigrants from Armenia |
| Minimum | 10.2% | 23.8% |
| Maximum | 92.3% | 77.6% |
| Range | 82.1% | 53.7% |
| Mean | 37.8% | 48.9% |
| Median | 38.0% | 49.2% |
| Interquartile 25% (IQ1) | 27.9% | 42.3% |
| Interquartile 75% (IQ3) | 46.5% | 56.4% |
| Interquartile Range (IQR) | 18.6% | 14.1% |
| Standard Deviation (Sample) | 14.5% | 11.1% |
| Standard Deviation (Population) | 14.4% | 11.0% |
Similar Demographics by Associate's Degree
Demographics Similar to Basques by Associate's Degree
In terms of associate's degree, the demographic groups most similar to Basques are Irish (46.5%, a difference of 0.060%), Peruvian (46.4%, a difference of 0.18%), Uruguayan (46.5%, a difference of 0.19%), Immigrants from Iraq (46.4%, a difference of 0.19%), and Immigrants from Somalia (46.5%, a difference of 0.20%).
| Demographics | Rating | Rank | Associate's Degree |
| Colombians | 62.4 /100 | #164 | Good 46.8% |
| Immigrants | South America | 59.9 /100 | #165 | Average 46.7% |
| Hungarians | 59.3 /100 | #166 | Average 46.7% |
| Immigrants | Sierra Leone | 59.2 /100 | #167 | Average 46.7% |
| Immigrants | Somalia | 55.5 /100 | #168 | Average 46.5% |
| Uruguayans | 55.4 /100 | #169 | Average 46.5% |
| Irish | 53.6 /100 | #170 | Average 46.5% |
| Basques | 52.8 /100 | #171 | Average 46.5% |
| Peruvians | 50.5 /100 | #172 | Average 46.4% |
| Immigrants | Iraq | 50.3 /100 | #173 | Average 46.4% |
| English | 50.0 /100 | #174 | Average 46.4% |
| Belgians | 48.9 /100 | #175 | Average 46.3% |
| Finns | 48.5 /100 | #176 | Average 46.3% |
| Slovaks | 48.4 /100 | #177 | Average 46.3% |
| Immigrants | Bosnia and Herzegovina | 48.3 /100 | #178 | Average 46.3% |
Demographics Similar to Immigrants from Armenia by Associate's Degree
In terms of associate's degree, the demographic groups most similar to Immigrants from Armenia are South American Indian (47.4%, a difference of 0.010%), Iraqi (47.4%, a difference of 0.040%), Immigrants from North Macedonia (47.4%, a difference of 0.060%), Danish (47.4%, a difference of 0.070%), and Immigrants from Sudan (47.4%, a difference of 0.13%).
| Demographics | Rating | Rank | Associate's Degree |
| Sierra Leoneans | 82.9 /100 | #142 | Excellent 47.7% |
| Norwegians | 81.0 /100 | #143 | Excellent 47.6% |
| Slavs | 80.5 /100 | #144 | Excellent 47.6% |
| Canadians | 79.0 /100 | #145 | Good 47.5% |
| Immigrants | Sudan | 77.9 /100 | #146 | Good 47.4% |
| Danes | 77.3 /100 | #147 | Good 47.4% |
| South American Indians | 76.7 /100 | #148 | Good 47.4% |
| Immigrants | Armenia | 76.6 /100 | #149 | Good 47.4% |
| Iraqis | 76.2 /100 | #150 | Good 47.4% |
| Immigrants | North Macedonia | 76.0 /100 | #151 | Good 47.4% |
| Immigrants | Afghanistan | 74.3 /100 | #152 | Good 47.3% |
| Czechs | 72.2 /100 | #153 | Good 47.2% |
| Immigrants | Kenya | 72.1 /100 | #154 | Good 47.2% |
| Kenyans | 70.6 /100 | #155 | Good 47.1% |
| South Americans | 70.5 /100 | #156 | Good 47.1% |