Pennsylvania German vs Bolivian No Schooling Completed
COMPARE
Pennsylvania German
Bolivian
No Schooling Completed
No Schooling Completed Comparison
Pennsylvania Germans
Bolivians
1.5%
NO SCHOOLING COMPLETED
100.0/ 100
METRIC RATING
24th/ 347
METRIC RANK
2.4%
NO SCHOOLING COMPLETED
1.4/ 100
METRIC RATING
245th/ 347
METRIC RANK
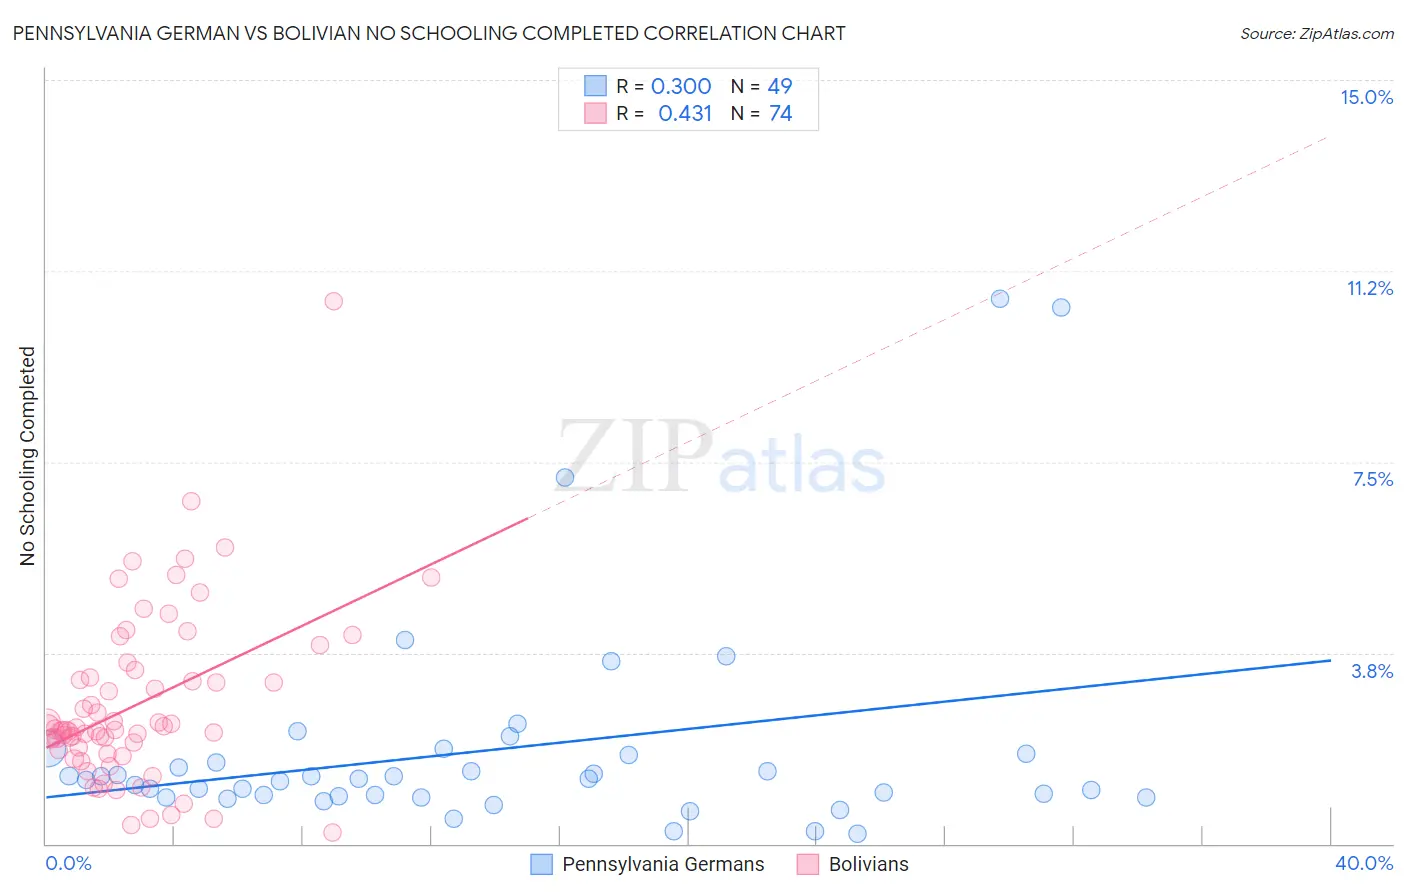
Pennsylvania German vs Bolivian No Schooling Completed Correlation Chart
The statistical analysis conducted on geographies consisting of 231,584,755 people shows a mild positive correlation between the proportion of Pennsylvania Germans and percentage of population with no schooling in the United States with a correlation coefficient (R) of 0.300 and weighted average of 1.5%. Similarly, the statistical analysis conducted on geographies consisting of 184,159,099 people shows a moderate positive correlation between the proportion of Bolivians and percentage of population with no schooling in the United States with a correlation coefficient (R) of 0.431 and weighted average of 2.4%, a difference of 61.1%.
No Schooling Completed Correlation Summary
| Measurement | Pennsylvania German | Bolivian |
| Minimum | 0.19% | 0.23% |
| Maximum | 10.7% | 10.7% |
| Range | 10.5% | 10.4% |
| Mean | 1.8% | 2.7% |
| Median | 1.3% | 2.2% |
| Interquartile 25% (IQ1) | 0.92% | 1.8% |
| Interquartile 75% (IQ3) | 1.8% | 3.3% |
| Interquartile Range (IQR) | 0.83% | 1.4% |
| Standard Deviation (Sample) | 2.2% | 1.7% |
| Standard Deviation (Population) | 2.1% | 1.7% |
Similar Demographics by No Schooling Completed
Demographics Similar to Pennsylvania Germans by No Schooling Completed
In terms of no schooling completed, the demographic groups most similar to Pennsylvania Germans are French (1.5%, a difference of 0.020%), European (1.5%, a difference of 0.35%), Alaska Native (1.5%, a difference of 0.61%), Czech (1.5%, a difference of 0.61%), and Chinese (1.5%, a difference of 0.70%).
| Demographics | Rating | Rank | No Schooling Completed |
| Croatians | 100.0 /100 | #17 | Exceptional 1.5% |
| Danes | 100.0 /100 | #18 | Exceptional 1.5% |
| Alaskan Athabascans | 100.0 /100 | #19 | Exceptional 1.5% |
| Welsh | 100.0 /100 | #20 | Exceptional 1.5% |
| Chinese | 100.0 /100 | #21 | Exceptional 1.5% |
| Alaska Natives | 100.0 /100 | #22 | Exceptional 1.5% |
| Europeans | 100.0 /100 | #23 | Exceptional 1.5% |
| Pennsylvania Germans | 100.0 /100 | #24 | Exceptional 1.5% |
| French | 100.0 /100 | #25 | Exceptional 1.5% |
| Czechs | 100.0 /100 | #26 | Exceptional 1.5% |
| Scandinavians | 100.0 /100 | #27 | Exceptional 1.5% |
| French Canadians | 100.0 /100 | #28 | Exceptional 1.5% |
| Lumbee | 100.0 /100 | #29 | Exceptional 1.5% |
| British | 100.0 /100 | #30 | Exceptional 1.5% |
| Inupiat | 100.0 /100 | #31 | Exceptional 1.5% |
Demographics Similar to Bolivians by No Schooling Completed
In terms of no schooling completed, the demographic groups most similar to Bolivians are Peruvian (2.4%, a difference of 0.010%), Immigrants from Congo (2.4%, a difference of 0.050%), South American (2.4%, a difference of 0.11%), Immigrants from Indonesia (2.4%, a difference of 0.15%), and Immigrants from Iraq (2.4%, a difference of 0.16%).
| Demographics | Rating | Rank | No Schooling Completed |
| Paiute | 1.9 /100 | #238 | Tragic 2.4% |
| Liberians | 1.8 /100 | #239 | Tragic 2.4% |
| Immigrants | Senegal | 1.7 /100 | #240 | Tragic 2.4% |
| Koreans | 1.7 /100 | #241 | Tragic 2.4% |
| Immigrants | Indonesia | 1.5 /100 | #242 | Tragic 2.4% |
| South Americans | 1.5 /100 | #243 | Tragic 2.4% |
| Peruvians | 1.4 /100 | #244 | Tragic 2.4% |
| Bolivians | 1.4 /100 | #245 | Tragic 2.4% |
| Immigrants | Congo | 1.4 /100 | #246 | Tragic 2.4% |
| Immigrants | Iraq | 1.3 /100 | #247 | Tragic 2.4% |
| Asians | 1.2 /100 | #248 | Tragic 2.4% |
| Jamaicans | 1.2 /100 | #249 | Tragic 2.4% |
| Immigrants | Middle Africa | 1.1 /100 | #250 | Tragic 2.4% |
| Immigrants | Africa | 1.1 /100 | #251 | Tragic 2.4% |
| Immigrants | Colombia | 1.0 /100 | #252 | Tragic 2.4% |