Chippewa vs Immigrants from Cabo Verde 10th Grade
COMPARE
Chippewa
Immigrants from Cabo Verde
10th Grade
10th Grade Comparison
Chippewa
Immigrants from Cabo Verde
95.0%
10TH GRADE
99.8/ 100
METRIC RATING
61st/ 347
METRIC RANK
89.5%
10TH GRADE
0.0/ 100
METRIC RATING
328th/ 347
METRIC RANK
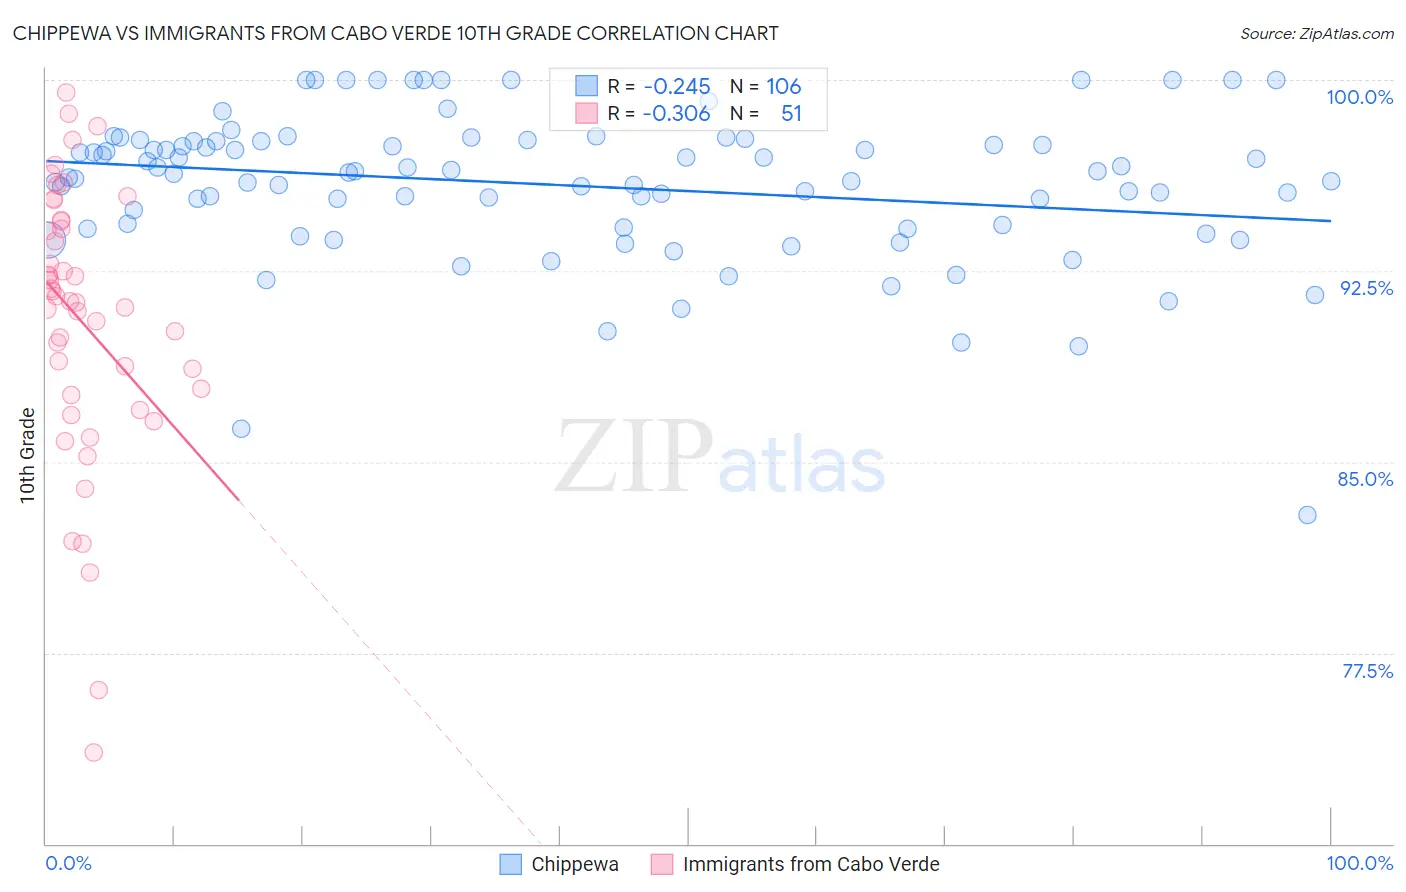
Chippewa vs Immigrants from Cabo Verde 10th Grade Correlation Chart
The statistical analysis conducted on geographies consisting of 215,067,289 people shows a weak negative correlation between the proportion of Chippewa and percentage of population with at least 10th grade education in the United States with a correlation coefficient (R) of -0.245 and weighted average of 95.0%. Similarly, the statistical analysis conducted on geographies consisting of 38,158,316 people shows a mild negative correlation between the proportion of Immigrants from Cabo Verde and percentage of population with at least 10th grade education in the United States with a correlation coefficient (R) of -0.306 and weighted average of 89.5%, a difference of 6.2%.
10th Grade Correlation Summary
| Measurement | Chippewa | Immigrants from Cabo Verde |
| Minimum | 82.9% | 73.6% |
| Maximum | 100.0% | 99.5% |
| Range | 17.1% | 25.9% |
| Mean | 95.9% | 90.6% |
| Median | 96.4% | 91.3% |
| Interquartile 25% (IQ1) | 94.2% | 87.6% |
| Interquartile 75% (IQ3) | 97.6% | 94.5% |
| Interquartile Range (IQR) | 3.4% | 6.8% |
| Standard Deviation (Sample) | 2.9% | 5.4% |
| Standard Deviation (Population) | 2.9% | 5.4% |
Similar Demographics by 10th Grade
Demographics Similar to Chippewa by 10th Grade
In terms of 10th grade, the demographic groups most similar to Chippewa are Cypriot (95.0%, a difference of 0.0%), Aleut (95.0%, a difference of 0.010%), Celtic (95.0%, a difference of 0.010%), Thai (95.0%, a difference of 0.010%), and Immigrants from Singapore (95.0%, a difference of 0.010%).
| Demographics | Rating | Rank | 10th Grade |
| Immigrants | Lithuania | 99.8 /100 | #54 | Exceptional 95.0% |
| Immigrants | Ireland | 99.8 /100 | #55 | Exceptional 95.0% |
| New Zealanders | 99.8 /100 | #56 | Exceptional 95.0% |
| Ukrainians | 99.8 /100 | #57 | Exceptional 95.0% |
| Aleuts | 99.8 /100 | #58 | Exceptional 95.0% |
| Celtics | 99.8 /100 | #59 | Exceptional 95.0% |
| Cypriots | 99.8 /100 | #60 | Exceptional 95.0% |
| Chippewa | 99.8 /100 | #61 | Exceptional 95.0% |
| Thais | 99.8 /100 | #62 | Exceptional 95.0% |
| Immigrants | Singapore | 99.8 /100 | #63 | Exceptional 95.0% |
| Native Hawaiians | 99.7 /100 | #64 | Exceptional 95.0% |
| Turks | 99.7 /100 | #65 | Exceptional 95.0% |
| Immigrants | Australia | 99.7 /100 | #66 | Exceptional 94.9% |
| Immigrants | Netherlands | 99.7 /100 | #67 | Exceptional 94.9% |
| Immigrants | Belgium | 99.7 /100 | #68 | Exceptional 94.9% |
Demographics Similar to Immigrants from Cabo Verde by 10th Grade
In terms of 10th grade, the demographic groups most similar to Immigrants from Cabo Verde are Immigrants from Nicaragua (89.5%, a difference of 0.010%), Dominican (89.4%, a difference of 0.10%), Central American Indian (89.7%, a difference of 0.27%), Puerto Rican (89.8%, a difference of 0.44%), and Immigrants from Yemen (89.1%, a difference of 0.45%).
| Demographics | Rating | Rank | 10th Grade |
| Belizeans | 0.0 /100 | #321 | Tragic 90.2% |
| Tohono O'odham | 0.0 /100 | #322 | Tragic 90.1% |
| Immigrants | Belize | 0.0 /100 | #323 | Tragic 90.1% |
| Immigrants | Armenia | 0.0 /100 | #324 | Tragic 89.9% |
| Puerto Ricans | 0.0 /100 | #325 | Tragic 89.8% |
| Central American Indians | 0.0 /100 | #326 | Tragic 89.7% |
| Immigrants | Nicaragua | 0.0 /100 | #327 | Tragic 89.5% |
| Immigrants | Cabo Verde | 0.0 /100 | #328 | Tragic 89.5% |
| Dominicans | 0.0 /100 | #329 | Tragic 89.4% |
| Immigrants | Yemen | 0.0 /100 | #330 | Tragic 89.1% |
| Mexican American Indians | 0.0 /100 | #331 | Tragic 89.0% |
| Immigrants | Azores | 0.0 /100 | #332 | Tragic 89.0% |
| Hondurans | 0.0 /100 | #333 | Tragic 89.0% |
| Hispanics or Latinos | 0.0 /100 | #334 | Tragic 88.9% |
| Immigrants | Dominican Republic | 0.0 /100 | #335 | Tragic 88.7% |