Chilean vs Immigrants from Belarus Master's Degree
COMPARE
Chilean
Immigrants from Belarus
Master's Degree
Master's Degree Comparison
Chileans
Immigrants from Belarus
16.9%
MASTER'S DEGREE
98.6/ 100
METRIC RATING
102nd/ 347
METRIC RANK
18.9%
MASTER'S DEGREE
100.0/ 100
METRIC RATING
45th/ 347
METRIC RANK
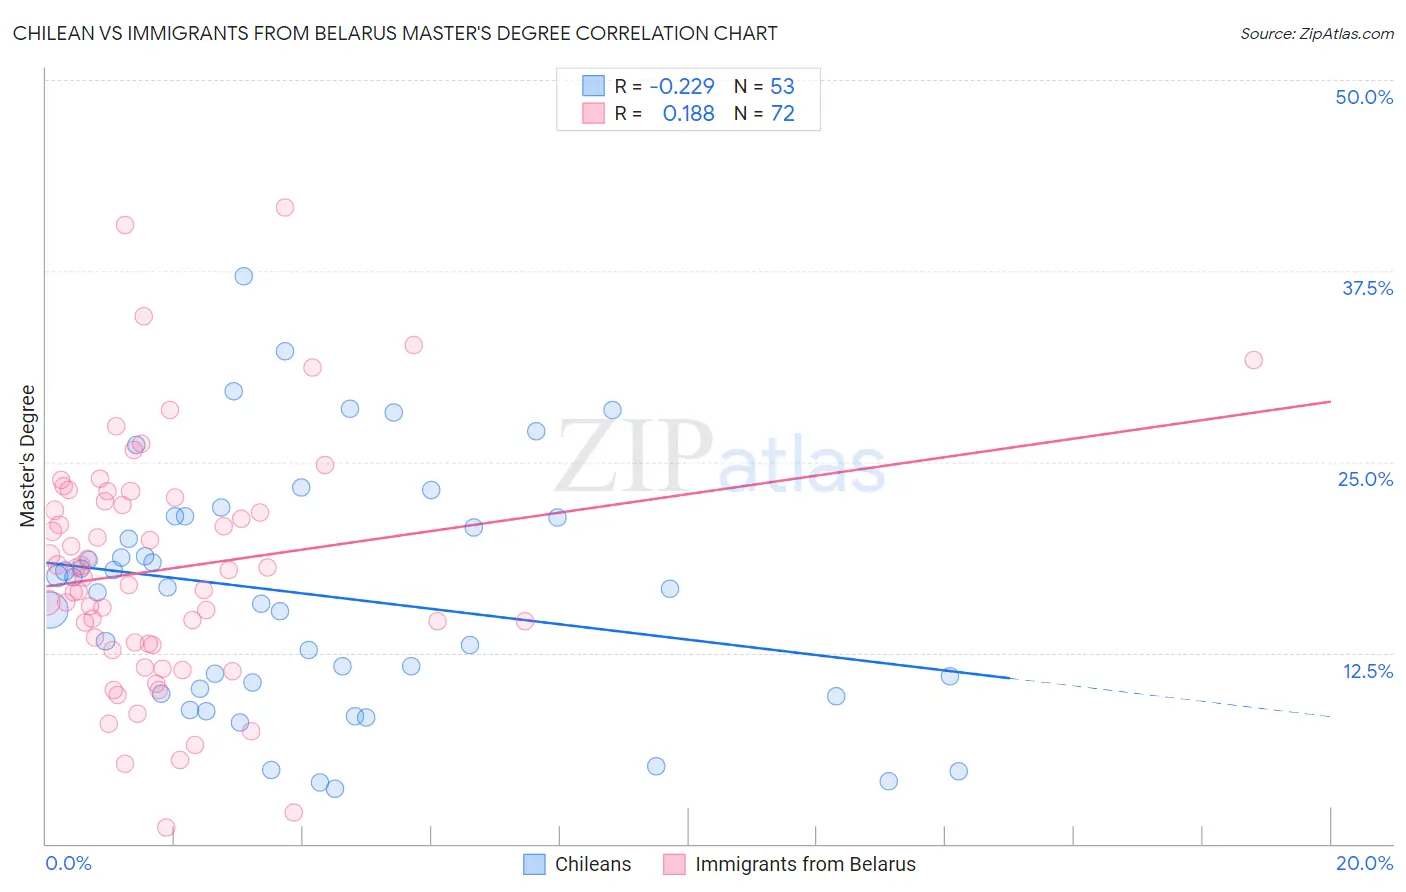
Chilean vs Immigrants from Belarus Master's Degree Correlation Chart
The statistical analysis conducted on geographies consisting of 256,643,247 people shows a weak negative correlation between the proportion of Chileans and percentage of population with at least master's degree education in the United States with a correlation coefficient (R) of -0.229 and weighted average of 16.9%. Similarly, the statistical analysis conducted on geographies consisting of 150,177,035 people shows a poor positive correlation between the proportion of Immigrants from Belarus and percentage of population with at least master's degree education in the United States with a correlation coefficient (R) of 0.188 and weighted average of 18.9%, a difference of 11.5%.
Master's Degree Correlation Summary
| Measurement | Chilean | Immigrants from Belarus |
| Minimum | 3.6% | 1.1% |
| Maximum | 37.2% | 41.7% |
| Range | 33.5% | 40.6% |
| Mean | 16.3% | 18.0% |
| Median | 16.7% | 17.7% |
| Interquartile 25% (IQ1) | 10.0% | 13.0% |
| Interquartile 75% (IQ3) | 21.4% | 22.5% |
| Interquartile Range (IQR) | 11.4% | 9.5% |
| Standard Deviation (Sample) | 7.9% | 8.0% |
| Standard Deviation (Population) | 7.8% | 7.9% |
Similar Demographics by Master's Degree
Demographics Similar to Chileans by Master's Degree
In terms of master's degree, the demographic groups most similar to Chileans are Immigrants from Nepal (17.0%, a difference of 0.080%), Albanian (17.0%, a difference of 0.26%), Alsatian (16.9%, a difference of 0.33%), Ukrainian (16.9%, a difference of 0.45%), and Laotian (17.0%, a difference of 0.47%).
| Demographics | Rating | Rank | Master's Degree |
| Immigrants | Morocco | 98.9 /100 | #95 | Exceptional 17.1% |
| Immigrants | Northern Africa | 98.9 /100 | #96 | Exceptional 17.1% |
| Immigrants | England | 98.8 /100 | #97 | Exceptional 17.0% |
| Immigrants | Ukraine | 98.8 /100 | #98 | Exceptional 17.0% |
| Laotians | 98.8 /100 | #99 | Exceptional 17.0% |
| Albanians | 98.7 /100 | #100 | Exceptional 17.0% |
| Immigrants | Nepal | 98.6 /100 | #101 | Exceptional 17.0% |
| Chileans | 98.6 /100 | #102 | Exceptional 16.9% |
| Alsatians | 98.4 /100 | #103 | Exceptional 16.9% |
| Ukrainians | 98.3 /100 | #104 | Exceptional 16.9% |
| Syrians | 98.3 /100 | #105 | Exceptional 16.8% |
| Immigrants | Albania | 98.1 /100 | #106 | Exceptional 16.8% |
| Armenians | 98.0 /100 | #107 | Exceptional 16.8% |
| Sierra Leoneans | 98.0 /100 | #108 | Exceptional 16.8% |
| Moroccans | 98.0 /100 | #109 | Exceptional 16.8% |
Demographics Similar to Immigrants from Belarus by Master's Degree
In terms of master's degree, the demographic groups most similar to Immigrants from Belarus are Immigrants from Malaysia (18.9%, a difference of 0.11%), Immigrants from Norway (18.8%, a difference of 0.38%), Immigrants from Greece (19.0%, a difference of 0.39%), Immigrants from Saudi Arabia (19.0%, a difference of 0.40%), and Immigrants from Austria (18.8%, a difference of 0.40%).
| Demographics | Rating | Rank | Master's Degree |
| Bolivians | 100.0 /100 | #38 | Exceptional 19.3% |
| Immigrants | Spain | 100.0 /100 | #39 | Exceptional 19.1% |
| Immigrants | Bolivia | 100.0 /100 | #40 | Exceptional 19.1% |
| Immigrants | Latvia | 100.0 /100 | #41 | Exceptional 19.1% |
| Immigrants | Saudi Arabia | 100.0 /100 | #42 | Exceptional 19.0% |
| Immigrants | Greece | 100.0 /100 | #43 | Exceptional 19.0% |
| Immigrants | Malaysia | 100.0 /100 | #44 | Exceptional 18.9% |
| Immigrants | Belarus | 100.0 /100 | #45 | Exceptional 18.9% |
| Immigrants | Norway | 100.0 /100 | #46 | Exceptional 18.8% |
| Immigrants | Austria | 100.0 /100 | #47 | Exceptional 18.8% |
| Paraguayans | 100.0 /100 | #48 | Exceptional 18.8% |
| Estonians | 100.0 /100 | #49 | Exceptional 18.8% |
| Bulgarians | 100.0 /100 | #50 | Exceptional 18.8% |
| Immigrants | South Africa | 100.0 /100 | #51 | Exceptional 18.8% |
| Immigrants | Kuwait | 100.0 /100 | #52 | Exceptional 18.6% |