Chilean vs Immigrants from Lebanon Master's Degree
COMPARE
Chilean
Immigrants from Lebanon
Master's Degree
Master's Degree Comparison
Chileans
Immigrants from Lebanon
16.9%
MASTER'S DEGREE
98.6/ 100
METRIC RATING
102nd/ 347
METRIC RANK
17.5%
MASTER'S DEGREE
99.6/ 100
METRIC RATING
79th/ 347
METRIC RANK
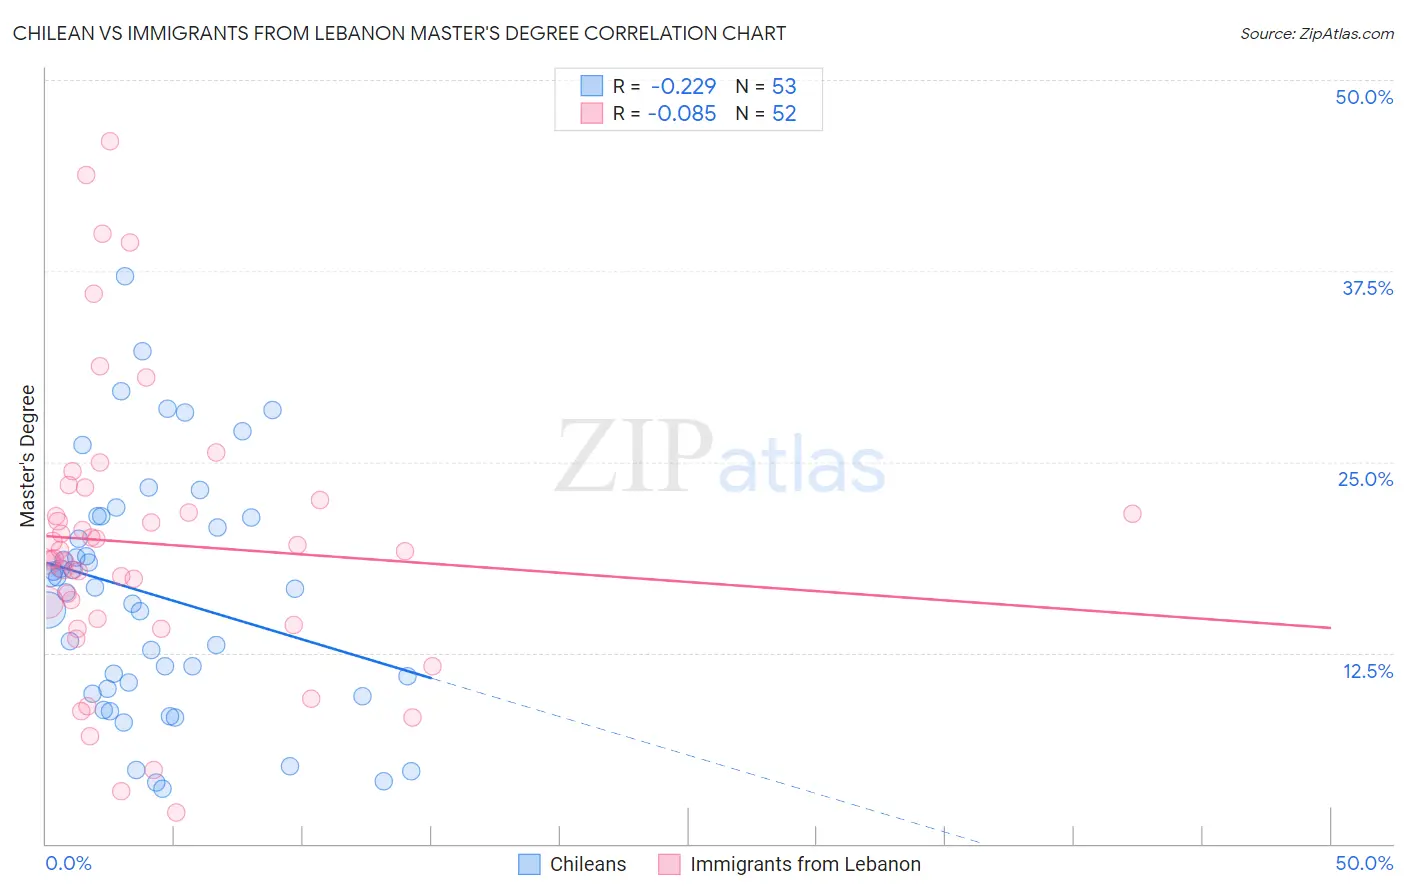
Chilean vs Immigrants from Lebanon Master's Degree Correlation Chart
The statistical analysis conducted on geographies consisting of 256,643,247 people shows a weak negative correlation between the proportion of Chileans and percentage of population with at least master's degree education in the United States with a correlation coefficient (R) of -0.229 and weighted average of 16.9%. Similarly, the statistical analysis conducted on geographies consisting of 217,153,820 people shows a slight negative correlation between the proportion of Immigrants from Lebanon and percentage of population with at least master's degree education in the United States with a correlation coefficient (R) of -0.085 and weighted average of 17.5%, a difference of 3.4%.
Master's Degree Correlation Summary
| Measurement | Chilean | Immigrants from Lebanon |
| Minimum | 3.6% | 2.0% |
| Maximum | 37.2% | 46.0% |
| Range | 33.5% | 43.9% |
| Mean | 16.3% | 19.7% |
| Median | 16.7% | 18.9% |
| Interquartile 25% (IQ1) | 10.0% | 14.5% |
| Interquartile 75% (IQ3) | 21.4% | 22.1% |
| Interquartile Range (IQR) | 11.4% | 7.6% |
| Standard Deviation (Sample) | 7.9% | 9.3% |
| Standard Deviation (Population) | 7.8% | 9.2% |
Similar Demographics by Master's Degree
Demographics Similar to Chileans by Master's Degree
In terms of master's degree, the demographic groups most similar to Chileans are Immigrants from Nepal (17.0%, a difference of 0.080%), Albanian (17.0%, a difference of 0.26%), Alsatian (16.9%, a difference of 0.33%), Ukrainian (16.9%, a difference of 0.45%), and Laotian (17.0%, a difference of 0.47%).
| Demographics | Rating | Rank | Master's Degree |
| Immigrants | Morocco | 98.9 /100 | #95 | Exceptional 17.1% |
| Immigrants | Northern Africa | 98.9 /100 | #96 | Exceptional 17.1% |
| Immigrants | England | 98.8 /100 | #97 | Exceptional 17.0% |
| Immigrants | Ukraine | 98.8 /100 | #98 | Exceptional 17.0% |
| Laotians | 98.8 /100 | #99 | Exceptional 17.0% |
| Albanians | 98.7 /100 | #100 | Exceptional 17.0% |
| Immigrants | Nepal | 98.6 /100 | #101 | Exceptional 17.0% |
| Chileans | 98.6 /100 | #102 | Exceptional 16.9% |
| Alsatians | 98.4 /100 | #103 | Exceptional 16.9% |
| Ukrainians | 98.3 /100 | #104 | Exceptional 16.9% |
| Syrians | 98.3 /100 | #105 | Exceptional 16.8% |
| Immigrants | Albania | 98.1 /100 | #106 | Exceptional 16.8% |
| Armenians | 98.0 /100 | #107 | Exceptional 16.8% |
| Sierra Leoneans | 98.0 /100 | #108 | Exceptional 16.8% |
| Moroccans | 98.0 /100 | #109 | Exceptional 16.8% |
Demographics Similar to Immigrants from Lebanon by Master's Degree
In terms of master's degree, the demographic groups most similar to Immigrants from Lebanon are Carpatho Rusyn (17.5%, a difference of 0.050%), Immigrants from Hungary (17.5%, a difference of 0.13%), Immigrants from Eastern Europe (17.6%, a difference of 0.33%), Immigrants from Western Asia (17.5%, a difference of 0.35%), and Greek (17.5%, a difference of 0.40%).
| Demographics | Rating | Rank | Master's Degree |
| Lithuanians | 99.7 /100 | #72 | Exceptional 17.7% |
| Zimbabweans | 99.7 /100 | #73 | Exceptional 17.7% |
| Immigrants | Romania | 99.7 /100 | #74 | Exceptional 17.7% |
| Egyptians | 99.6 /100 | #75 | Exceptional 17.6% |
| Immigrants | Indonesia | 99.6 /100 | #76 | Exceptional 17.6% |
| Immigrants | Eastern Europe | 99.6 /100 | #77 | Exceptional 17.6% |
| Immigrants | Hungary | 99.6 /100 | #78 | Exceptional 17.5% |
| Immigrants | Lebanon | 99.6 /100 | #79 | Exceptional 17.5% |
| Carpatho Rusyns | 99.6 /100 | #80 | Exceptional 17.5% |
| Immigrants | Western Asia | 99.5 /100 | #81 | Exceptional 17.5% |
| Greeks | 99.5 /100 | #82 | Exceptional 17.5% |
| Immigrants | Zimbabwe | 99.5 /100 | #83 | Exceptional 17.4% |
| Immigrants | Scotland | 99.4 /100 | #84 | Exceptional 17.4% |
| Immigrants | Brazil | 99.4 /100 | #85 | Exceptional 17.4% |
| Immigrants | Croatia | 99.3 /100 | #86 | Exceptional 17.3% |