Afghan vs Immigrants from Norway Doctorate Degree
COMPARE
Afghan
Immigrants from Norway
Doctorate Degree
Doctorate Degree Comparison
Afghans
Immigrants from Norway
2.0%
DOCTORATE DEGREE
87.2/ 100
METRIC RATING
139th/ 347
METRIC RANK
2.4%
DOCTORATE DEGREE
100.0/ 100
METRIC RATING
50th/ 347
METRIC RANK
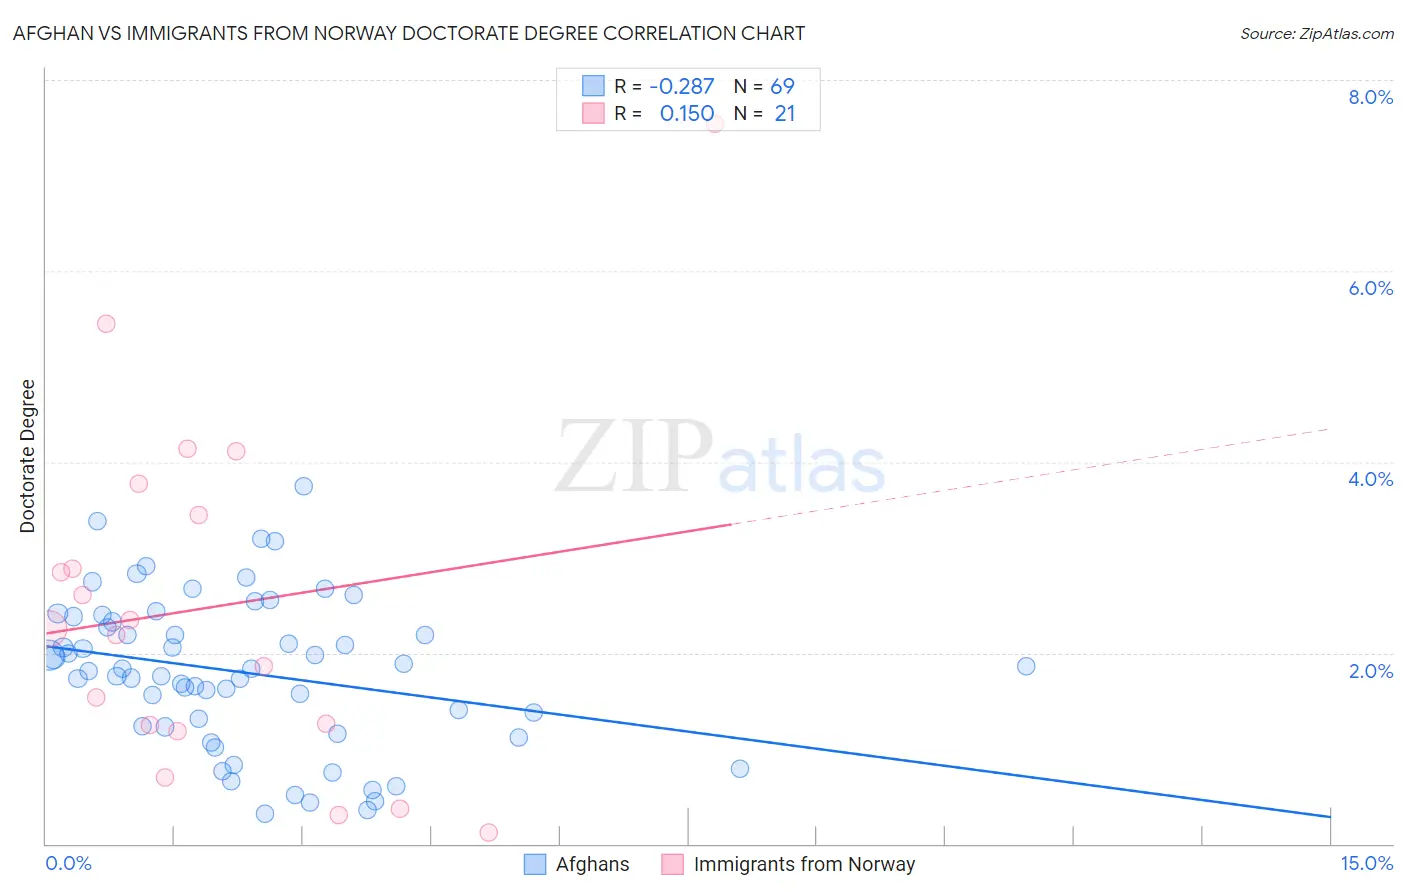
Afghan vs Immigrants from Norway Doctorate Degree Correlation Chart
The statistical analysis conducted on geographies consisting of 148,659,746 people shows a weak negative correlation between the proportion of Afghans and percentage of population with at least doctorate degree education in the United States with a correlation coefficient (R) of -0.287 and weighted average of 2.0%. Similarly, the statistical analysis conducted on geographies consisting of 116,506,510 people shows a poor positive correlation between the proportion of Immigrants from Norway and percentage of population with at least doctorate degree education in the United States with a correlation coefficient (R) of 0.150 and weighted average of 2.4%, a difference of 21.9%.
Doctorate Degree Correlation Summary
| Measurement | Afghan | Immigrants from Norway |
| Minimum | 0.32% | 0.12% |
| Maximum | 3.7% | 7.5% |
| Range | 3.4% | 7.4% |
| Mean | 1.8% | 2.5% |
| Median | 1.8% | 2.3% |
| Interquartile 25% (IQ1) | 1.2% | 1.2% |
| Interquartile 75% (IQ3) | 2.4% | 3.6% |
| Interquartile Range (IQR) | 1.1% | 2.4% |
| Standard Deviation (Sample) | 0.79% | 1.8% |
| Standard Deviation (Population) | 0.78% | 1.8% |
Similar Demographics by Doctorate Degree
Demographics Similar to Afghans by Doctorate Degree
In terms of doctorate degree, the demographic groups most similar to Afghans are Immigrants from Africa (2.0%, a difference of 0.080%), Senegalese (2.0%, a difference of 0.16%), Swiss (2.0%, a difference of 0.23%), Swedish (2.0%, a difference of 0.32%), and South American Indian (2.0%, a difference of 0.32%).
| Demographics | Rating | Rank | Doctorate Degree |
| Scottish | 89.4 /100 | #132 | Excellent 2.0% |
| Immigrants | Uzbekistan | 89.3 /100 | #133 | Excellent 2.0% |
| Immigrants | Cameroon | 88.9 /100 | #134 | Excellent 2.0% |
| Serbians | 88.7 /100 | #135 | Excellent 2.0% |
| Swedes | 88.3 /100 | #136 | Excellent 2.0% |
| South American Indians | 88.3 /100 | #137 | Excellent 2.0% |
| Swiss | 88.0 /100 | #138 | Excellent 2.0% |
| Afghans | 87.2 /100 | #139 | Excellent 2.0% |
| Immigrants | Africa | 87.0 /100 | #140 | Excellent 2.0% |
| Senegalese | 86.7 /100 | #141 | Excellent 2.0% |
| Italians | 86.0 /100 | #142 | Excellent 2.0% |
| Sierra Leoneans | 85.1 /100 | #143 | Excellent 2.0% |
| Immigrants | Moldova | 84.3 /100 | #144 | Excellent 2.0% |
| Kenyans | 83.6 /100 | #145 | Excellent 1.9% |
| Immigrants | Syria | 83.6 /100 | #146 | Excellent 1.9% |
Demographics Similar to Immigrants from Norway by Doctorate Degree
In terms of doctorate degree, the demographic groups most similar to Immigrants from Norway are Australian (2.4%, a difference of 0.090%), Bulgarian (2.4%, a difference of 0.56%), Immigrants from Latvia (2.4%, a difference of 0.68%), Immigrants from Asia (2.4%, a difference of 1.1%), and Asian (2.4%, a difference of 1.3%).
| Demographics | Rating | Rank | Doctorate Degree |
| Soviet Union | 100.0 /100 | #43 | Exceptional 2.5% |
| Immigrants | Netherlands | 100.0 /100 | #44 | Exceptional 2.5% |
| Immigrants | South Africa | 100.0 /100 | #45 | Exceptional 2.4% |
| Immigrants | Austria | 100.0 /100 | #46 | Exceptional 2.4% |
| Immigrants | Western Europe | 100.0 /100 | #47 | Exceptional 2.4% |
| Asians | 100.0 /100 | #48 | Exceptional 2.4% |
| Immigrants | Asia | 100.0 /100 | #49 | Exceptional 2.4% |
| Immigrants | Norway | 100.0 /100 | #50 | Exceptional 2.4% |
| Australians | 100.0 /100 | #51 | Exceptional 2.4% |
| Bulgarians | 100.0 /100 | #52 | Exceptional 2.4% |
| Immigrants | Latvia | 100.0 /100 | #53 | Exceptional 2.4% |
| Immigrants | Indonesia | 100.0 /100 | #54 | Exceptional 2.4% |
| Bolivians | 100.0 /100 | #55 | Exceptional 2.4% |
| Immigrants | Czechoslovakia | 100.0 /100 | #56 | Exceptional 2.4% |
| Immigrants | Ethiopia | 100.0 /100 | #57 | Exceptional 2.4% |