Cheyenne vs Haitian Associate's Degree
COMPARE
Cheyenne
Haitian
Associate's Degree
Associate's Degree Comparison
Cheyenne
Haitians
38.7%
ASSOCIATE'S DEGREE
0.0/ 100
METRIC RATING
298th/ 347
METRIC RANK
40.0%
ASSOCIATE'S DEGREE
0.1/ 100
METRIC RATING
283rd/ 347
METRIC RANK
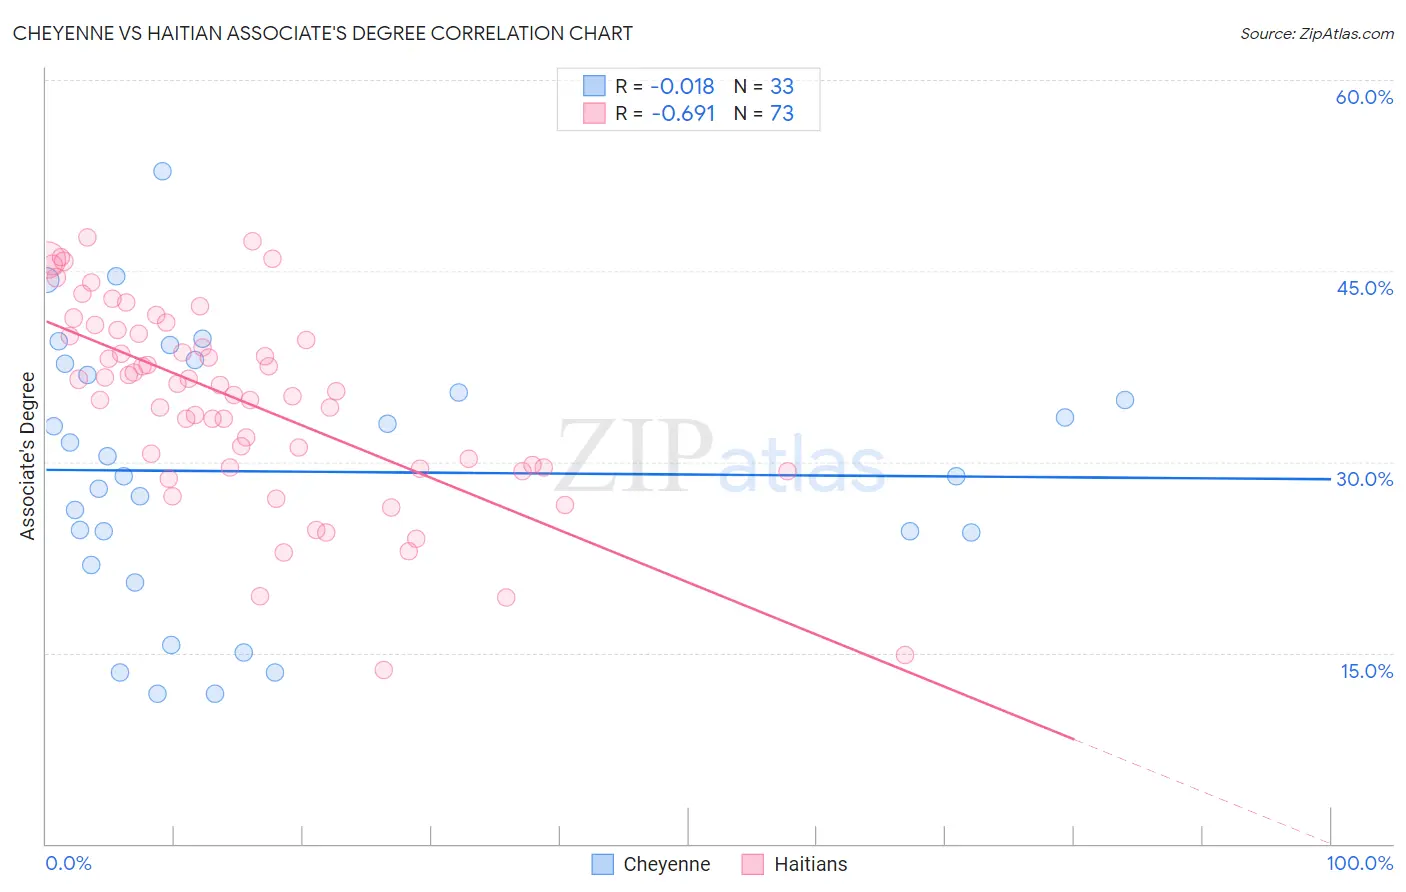
Cheyenne vs Haitian Associate's Degree Correlation Chart
The statistical analysis conducted on geographies consisting of 80,719,085 people shows no correlation between the proportion of Cheyenne and percentage of population with at least associate's degree education in the United States with a correlation coefficient (R) of -0.018 and weighted average of 38.7%. Similarly, the statistical analysis conducted on geographies consisting of 287,980,530 people shows a significant negative correlation between the proportion of Haitians and percentage of population with at least associate's degree education in the United States with a correlation coefficient (R) of -0.691 and weighted average of 40.0%, a difference of 3.4%.
Associate's Degree Correlation Summary
| Measurement | Cheyenne | Haitian |
| Minimum | 11.8% | 13.6% |
| Maximum | 52.8% | 47.6% |
| Range | 41.1% | 34.0% |
| Mean | 29.2% | 34.8% |
| Median | 28.8% | 36.1% |
| Interquartile 25% (IQ1) | 23.2% | 29.5% |
| Interquartile 75% (IQ3) | 37.3% | 40.2% |
| Interquartile Range (IQR) | 14.1% | 10.7% |
| Standard Deviation (Sample) | 10.3% | 7.7% |
| Standard Deviation (Population) | 10.1% | 7.6% |
Demographics Similar to Cheyenne and Haitians by Associate's Degree
In terms of associate's degree, the demographic groups most similar to Cheyenne are Ute (38.6%, a difference of 0.090%), Chickasaw (38.6%, a difference of 0.13%), Cape Verdean (38.8%, a difference of 0.26%), Cherokee (38.9%, a difference of 0.55%), and Honduran (38.9%, a difference of 0.72%). Similarly, the demographic groups most similar to Haitians are Comanche (39.9%, a difference of 0.12%), Bangladeshi (40.0%, a difference of 0.15%), Immigrants from Belize (39.9%, a difference of 0.21%), Immigrants from Portugal (40.1%, a difference of 0.46%), and Immigrants from Caribbean (39.7%, a difference of 0.55%).
| Demographics | Rating | Rank | Associate's Degree |
| Immigrants | Micronesia | 0.1 /100 | #280 | Tragic 40.2% |
| Immigrants | Portugal | 0.1 /100 | #281 | Tragic 40.1% |
| Bangladeshis | 0.1 /100 | #282 | Tragic 40.0% |
| Haitians | 0.1 /100 | #283 | Tragic 40.0% |
| Comanche | 0.1 /100 | #284 | Tragic 39.9% |
| Immigrants | Belize | 0.1 /100 | #285 | Tragic 39.9% |
| Immigrants | Caribbean | 0.0 /100 | #286 | Tragic 39.7% |
| Aleuts | 0.0 /100 | #287 | Tragic 39.6% |
| Immigrants | Cuba | 0.0 /100 | #288 | Tragic 39.5% |
| Central Americans | 0.0 /100 | #289 | Tragic 39.4% |
| Immigrants | Haiti | 0.0 /100 | #290 | Tragic 39.3% |
| Dominicans | 0.0 /100 | #291 | Tragic 39.3% |
| Blacks/African Americans | 0.0 /100 | #292 | Tragic 39.1% |
| Nepalese | 0.0 /100 | #293 | Tragic 39.0% |
| Salvadorans | 0.0 /100 | #294 | Tragic 39.0% |
| Hondurans | 0.0 /100 | #295 | Tragic 38.9% |
| Cherokee | 0.0 /100 | #296 | Tragic 38.9% |
| Cape Verdeans | 0.0 /100 | #297 | Tragic 38.8% |
| Cheyenne | 0.0 /100 | #298 | Tragic 38.7% |
| Ute | 0.0 /100 | #299 | Tragic 38.6% |
| Chickasaw | 0.0 /100 | #300 | Tragic 38.6% |