Immigrants from Uganda vs Russian College, Under 1 year
COMPARE
Immigrants from Uganda
Russian
College, Under 1 year
College, Under 1 year Comparison
Immigrants from Uganda
Russians
66.5%
COLLEGE, UNDER 1 YEAR
82.8/ 100
METRIC RATING
143rd/ 347
METRIC RANK
70.5%
COLLEGE, UNDER 1 YEAR
99.9/ 100
METRIC RATING
35th/ 347
METRIC RANK
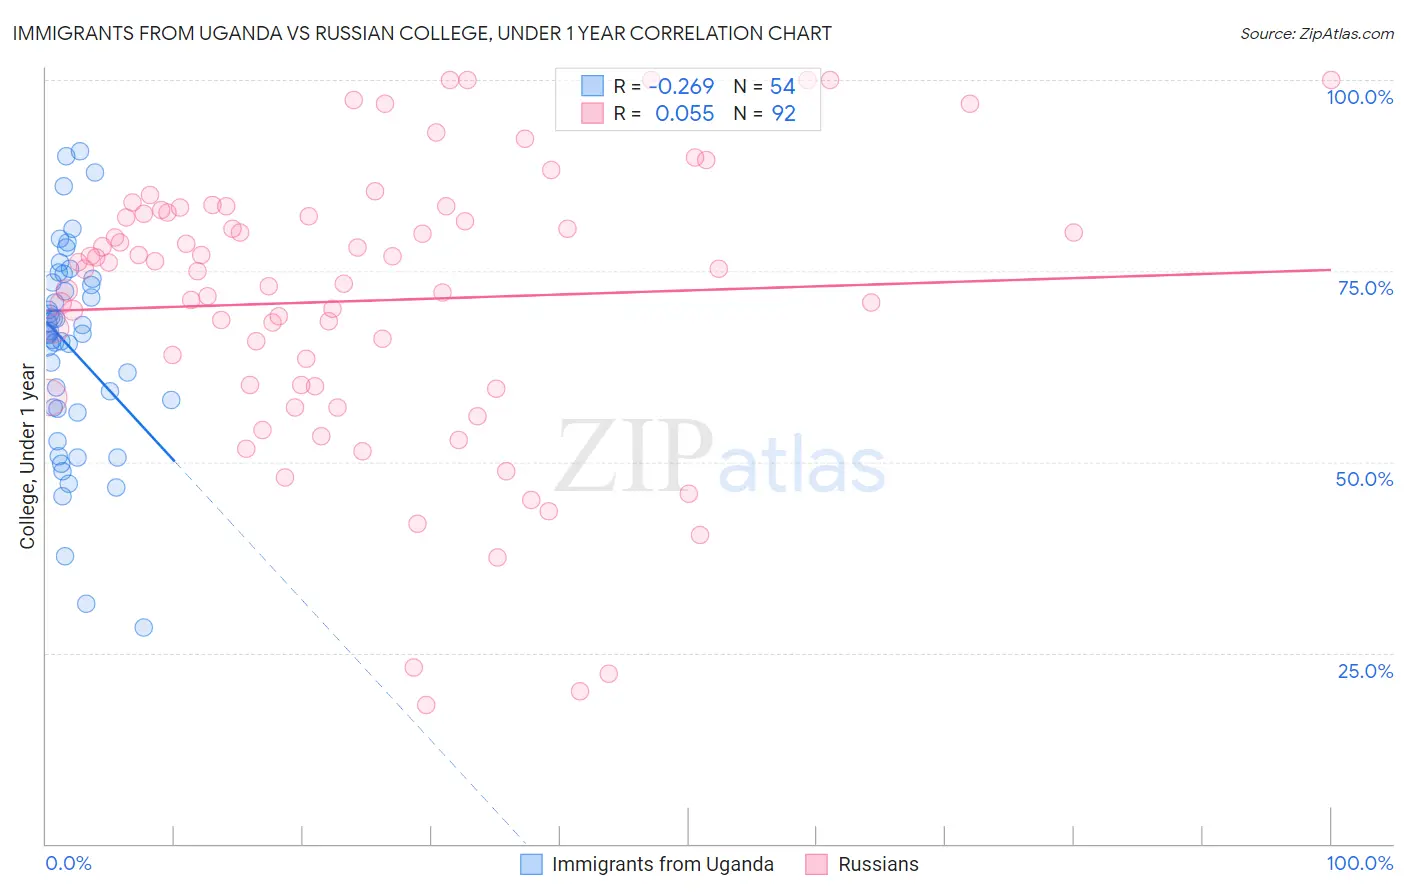
Immigrants from Uganda vs Russian College, Under 1 year Correlation Chart
The statistical analysis conducted on geographies consisting of 125,982,535 people shows a weak negative correlation between the proportion of Immigrants from Uganda and percentage of population with at least college, under 1 year education in the United States with a correlation coefficient (R) of -0.269 and weighted average of 66.5%. Similarly, the statistical analysis conducted on geographies consisting of 512,255,371 people shows a slight positive correlation between the proportion of Russians and percentage of population with at least college, under 1 year education in the United States with a correlation coefficient (R) of 0.055 and weighted average of 70.5%, a difference of 6.0%.
College, Under 1 year Correlation Summary
| Measurement | Immigrants from Uganda | Russian |
| Minimum | 28.3% | 18.2% |
| Maximum | 90.7% | 100.0% |
| Range | 62.4% | 81.8% |
| Mean | 64.8% | 71.1% |
| Median | 66.8% | 75.2% |
| Interquartile 25% (IQ1) | 57.0% | 60.0% |
| Interquartile 75% (IQ3) | 73.5% | 82.5% |
| Interquartile Range (IQR) | 16.6% | 22.5% |
| Standard Deviation (Sample) | 13.6% | 18.5% |
| Standard Deviation (Population) | 13.5% | 18.4% |
Similar Demographics by College, Under 1 year
Demographics Similar to Immigrants from Uganda by College, Under 1 year
In terms of college, under 1 year, the demographic groups most similar to Immigrants from Uganda are English (66.6%, a difference of 0.010%), Immigrants from Germany (66.5%, a difference of 0.060%), Immigrants from Kenya (66.5%, a difference of 0.070%), Kenyan (66.5%, a difference of 0.080%), and Immigrants from Morocco (66.5%, a difference of 0.080%).
| Demographics | Rating | Rank | College, Under 1 year |
| Ugandans | 87.8 /100 | #136 | Excellent 66.8% |
| Immigrants | Chile | 87.4 /100 | #137 | Excellent 66.8% |
| Immigrants | Italy | 86.9 /100 | #138 | Excellent 66.8% |
| Venezuelans | 85.9 /100 | #139 | Excellent 66.7% |
| Slavs | 85.9 /100 | #140 | Excellent 66.7% |
| Immigrants | Afghanistan | 85.1 /100 | #141 | Excellent 66.7% |
| English | 82.9 /100 | #142 | Excellent 66.6% |
| Immigrants | Uganda | 82.8 /100 | #143 | Excellent 66.5% |
| Immigrants | Germany | 82.0 /100 | #144 | Excellent 66.5% |
| Immigrants | Kenya | 81.8 /100 | #145 | Excellent 66.5% |
| Kenyans | 81.7 /100 | #146 | Excellent 66.5% |
| Immigrants | Morocco | 81.7 /100 | #147 | Excellent 66.5% |
| Taiwanese | 78.6 /100 | #148 | Good 66.4% |
| Immigrants | Venezuela | 77.9 /100 | #149 | Good 66.3% |
| Immigrants | Iraq | 77.1 /100 | #150 | Good 66.3% |
Demographics Similar to Russians by College, Under 1 year
In terms of college, under 1 year, the demographic groups most similar to Russians are Immigrants from Sri Lanka (70.5%, a difference of 0.060%), Estonian (70.6%, a difference of 0.080%), Immigrants from South Africa (70.6%, a difference of 0.10%), Immigrants from Saudi Arabia (70.4%, a difference of 0.17%), and Australian (70.4%, a difference of 0.25%).
| Demographics | Rating | Rank | College, Under 1 year |
| Immigrants | Hong Kong | 100.0 /100 | #28 | Exceptional 71.0% |
| Immigrants | France | 100.0 /100 | #29 | Exceptional 71.0% |
| Immigrants | China | 99.9 /100 | #30 | Exceptional 70.9% |
| Indians (Asian) | 99.9 /100 | #31 | Exceptional 70.8% |
| Turks | 99.9 /100 | #32 | Exceptional 70.7% |
| Immigrants | South Africa | 99.9 /100 | #33 | Exceptional 70.6% |
| Estonians | 99.9 /100 | #34 | Exceptional 70.6% |
| Russians | 99.9 /100 | #35 | Exceptional 70.5% |
| Immigrants | Sri Lanka | 99.9 /100 | #36 | Exceptional 70.5% |
| Immigrants | Saudi Arabia | 99.9 /100 | #37 | Exceptional 70.4% |
| Australians | 99.9 /100 | #38 | Exceptional 70.4% |
| Bhutanese | 99.9 /100 | #39 | Exceptional 70.3% |
| Immigrants | Turkey | 99.9 /100 | #40 | Exceptional 70.3% |
| Immigrants | Kuwait | 99.9 /100 | #41 | Exceptional 70.3% |
| Immigrants | Lithuania | 99.9 /100 | #42 | Exceptional 70.3% |