Hungarian vs Russian College, Under 1 year
COMPARE
Hungarian
Russian
College, Under 1 year
College, Under 1 year Comparison
Hungarians
Russians
65.6%
COLLEGE, UNDER 1 YEAR
55.9/ 100
METRIC RATING
168th/ 347
METRIC RANK
70.5%
COLLEGE, UNDER 1 YEAR
99.9/ 100
METRIC RATING
35th/ 347
METRIC RANK
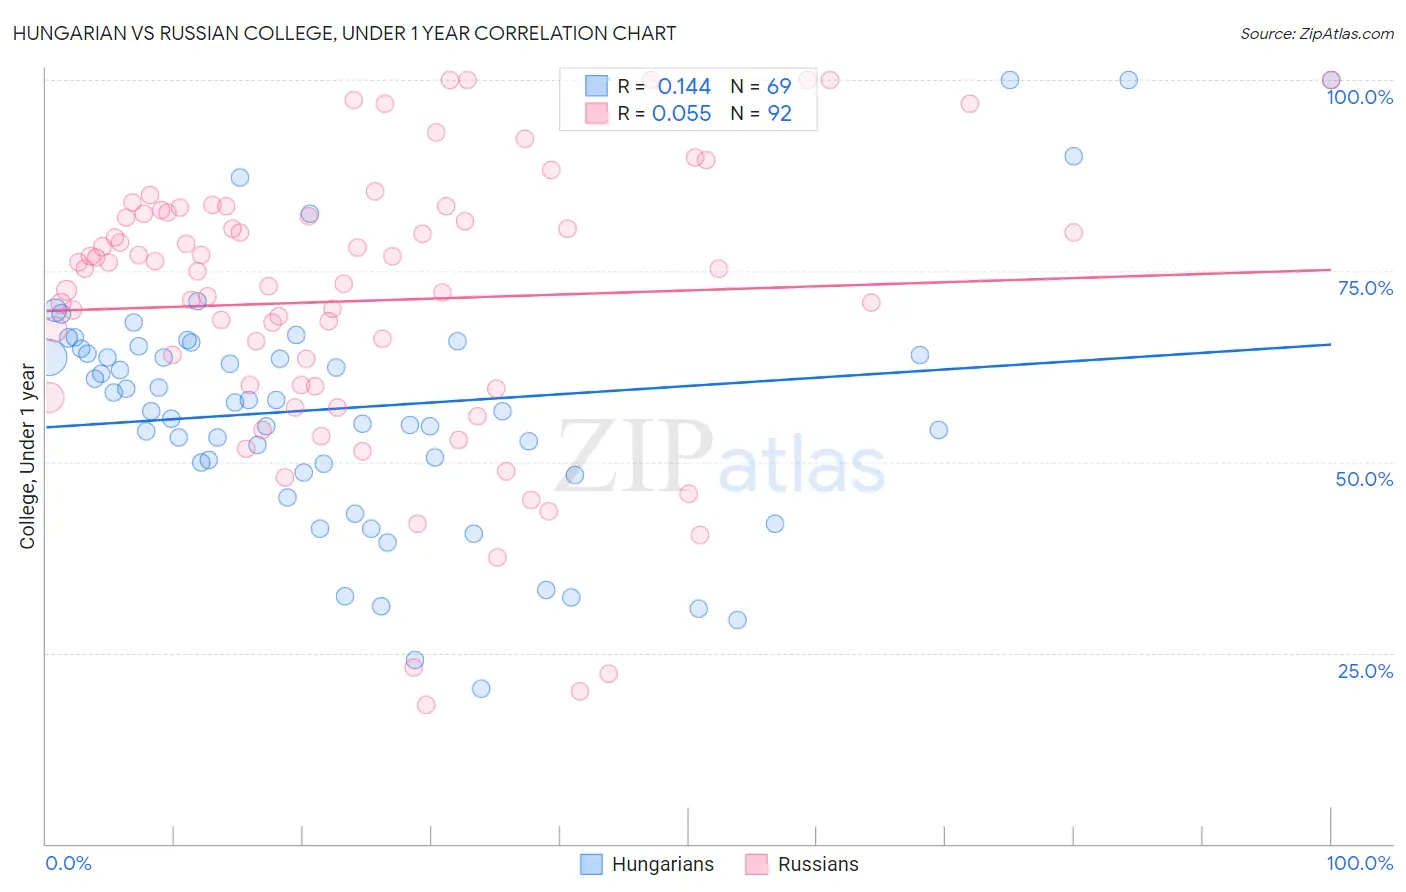
Hungarian vs Russian College, Under 1 year Correlation Chart
The statistical analysis conducted on geographies consisting of 486,238,564 people shows a poor positive correlation between the proportion of Hungarians and percentage of population with at least college, under 1 year education in the United States with a correlation coefficient (R) of 0.144 and weighted average of 65.6%. Similarly, the statistical analysis conducted on geographies consisting of 512,255,371 people shows a slight positive correlation between the proportion of Russians and percentage of population with at least college, under 1 year education in the United States with a correlation coefficient (R) of 0.055 and weighted average of 70.5%, a difference of 7.5%.
College, Under 1 year Correlation Summary
| Measurement | Hungarian | Russian |
| Minimum | 20.2% | 18.2% |
| Maximum | 100.0% | 100.0% |
| Range | 79.8% | 81.8% |
| Mean | 57.1% | 71.1% |
| Median | 57.8% | 75.2% |
| Interquartile 25% (IQ1) | 49.2% | 60.0% |
| Interquartile 75% (IQ3) | 65.0% | 82.5% |
| Interquartile Range (IQR) | 15.8% | 22.5% |
| Standard Deviation (Sample) | 16.4% | 18.5% |
| Standard Deviation (Population) | 16.3% | 18.4% |
Similar Demographics by College, Under 1 year
Demographics Similar to Hungarians by College, Under 1 year
In terms of college, under 1 year, the demographic groups most similar to Hungarians are Yugoslavian (65.6%, a difference of 0.010%), German (65.6%, a difference of 0.010%), Immigrants from Somalia (65.6%, a difference of 0.020%), Moroccan (65.6%, a difference of 0.030%), and Immigrants from Oceania (65.6%, a difference of 0.040%).
| Demographics | Rating | Rank | College, Under 1 year |
| Brazilians | 66.0 /100 | #161 | Good 65.9% |
| Koreans | 65.3 /100 | #162 | Good 65.9% |
| Somalis | 62.7 /100 | #163 | Good 65.8% |
| Czechoslovakians | 62.6 /100 | #164 | Good 65.8% |
| Immigrants | Uzbekistan | 61.6 /100 | #165 | Good 65.8% |
| Moroccans | 56.7 /100 | #166 | Average 65.6% |
| Immigrants | Somalia | 56.4 /100 | #167 | Average 65.6% |
| Hungarians | 55.9 /100 | #168 | Average 65.6% |
| Yugoslavians | 55.7 /100 | #169 | Average 65.6% |
| Germans | 55.7 /100 | #170 | Average 65.6% |
| Immigrants | Oceania | 55.0 /100 | #171 | Average 65.6% |
| South American Indians | 54.4 /100 | #172 | Average 65.5% |
| Swiss | 53.9 /100 | #173 | Average 65.5% |
| Immigrants | Bosnia and Herzegovina | 50.0 /100 | #174 | Average 65.4% |
| Scotch-Irish | 49.5 /100 | #175 | Average 65.4% |
Demographics Similar to Russians by College, Under 1 year
In terms of college, under 1 year, the demographic groups most similar to Russians are Immigrants from Sri Lanka (70.5%, a difference of 0.060%), Estonian (70.6%, a difference of 0.080%), Immigrants from South Africa (70.6%, a difference of 0.10%), Immigrants from Saudi Arabia (70.4%, a difference of 0.17%), and Australian (70.4%, a difference of 0.25%).
| Demographics | Rating | Rank | College, Under 1 year |
| Immigrants | Hong Kong | 100.0 /100 | #28 | Exceptional 71.0% |
| Immigrants | France | 100.0 /100 | #29 | Exceptional 71.0% |
| Immigrants | China | 99.9 /100 | #30 | Exceptional 70.9% |
| Indians (Asian) | 99.9 /100 | #31 | Exceptional 70.8% |
| Turks | 99.9 /100 | #32 | Exceptional 70.7% |
| Immigrants | South Africa | 99.9 /100 | #33 | Exceptional 70.6% |
| Estonians | 99.9 /100 | #34 | Exceptional 70.6% |
| Russians | 99.9 /100 | #35 | Exceptional 70.5% |
| Immigrants | Sri Lanka | 99.9 /100 | #36 | Exceptional 70.5% |
| Immigrants | Saudi Arabia | 99.9 /100 | #37 | Exceptional 70.4% |
| Australians | 99.9 /100 | #38 | Exceptional 70.4% |
| Bhutanese | 99.9 /100 | #39 | Exceptional 70.3% |
| Immigrants | Turkey | 99.9 /100 | #40 | Exceptional 70.3% |
| Immigrants | Kuwait | 99.9 /100 | #41 | Exceptional 70.3% |
| Immigrants | Lithuania | 99.9 /100 | #42 | Exceptional 70.3% |