Immigrants from Norway vs Russian College, Under 1 year
COMPARE
Immigrants from Norway
Russian
College, Under 1 year
College, Under 1 year Comparison
Immigrants from Norway
Russians
70.2%
COLLEGE, UNDER 1 YEAR
99.9/ 100
METRIC RATING
45th/ 347
METRIC RANK
70.5%
COLLEGE, UNDER 1 YEAR
99.9/ 100
METRIC RATING
35th/ 347
METRIC RANK
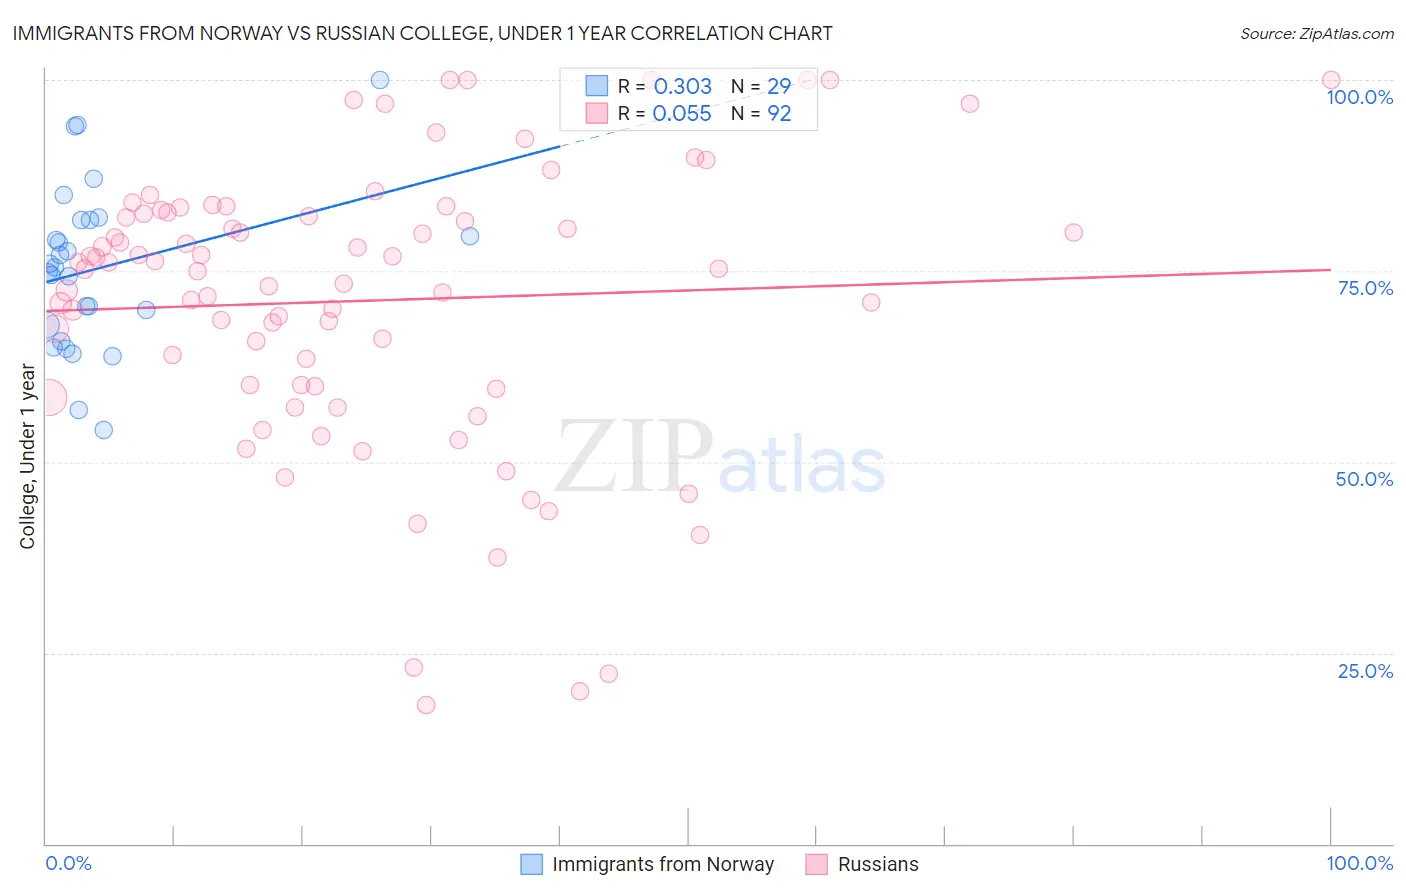
Immigrants from Norway vs Russian College, Under 1 year Correlation Chart
The statistical analysis conducted on geographies consisting of 116,716,420 people shows a mild positive correlation between the proportion of Immigrants from Norway and percentage of population with at least college, under 1 year education in the United States with a correlation coefficient (R) of 0.303 and weighted average of 70.2%. Similarly, the statistical analysis conducted on geographies consisting of 512,255,371 people shows a slight positive correlation between the proportion of Russians and percentage of population with at least college, under 1 year education in the United States with a correlation coefficient (R) of 0.055 and weighted average of 70.5%, a difference of 0.45%.
College, Under 1 year Correlation Summary
| Measurement | Immigrants from Norway | Russian |
| Minimum | 54.2% | 18.2% |
| Maximum | 100.0% | 100.0% |
| Range | 45.8% | 81.8% |
| Mean | 75.4% | 71.1% |
| Median | 75.5% | 75.2% |
| Interquartile 25% (IQ1) | 66.8% | 60.0% |
| Interquartile 75% (IQ3) | 81.7% | 82.5% |
| Interquartile Range (IQR) | 14.9% | 22.5% |
| Standard Deviation (Sample) | 10.7% | 18.5% |
| Standard Deviation (Population) | 10.5% | 18.4% |
Demographics Similar to Immigrants from Norway and Russians by College, Under 1 year
In terms of college, under 1 year, the demographic groups most similar to Immigrants from Norway are Israeli (70.2%, a difference of 0.020%), New Zealander (70.2%, a difference of 0.020%), Immigrants from Lithuania (70.3%, a difference of 0.090%), Immigrants from Latvia (70.1%, a difference of 0.12%), and Immigrants from Kuwait (70.3%, a difference of 0.14%). Similarly, the demographic groups most similar to Russians are Immigrants from Sri Lanka (70.5%, a difference of 0.060%), Estonian (70.6%, a difference of 0.080%), Immigrants from South Africa (70.6%, a difference of 0.10%), Immigrants from Saudi Arabia (70.4%, a difference of 0.17%), and Australian (70.4%, a difference of 0.25%).
| Demographics | Rating | Rank | College, Under 1 year |
| Immigrants | China | 99.9 /100 | #30 | Exceptional 70.9% |
| Indians (Asian) | 99.9 /100 | #31 | Exceptional 70.8% |
| Turks | 99.9 /100 | #32 | Exceptional 70.7% |
| Immigrants | South Africa | 99.9 /100 | #33 | Exceptional 70.6% |
| Estonians | 99.9 /100 | #34 | Exceptional 70.6% |
| Russians | 99.9 /100 | #35 | Exceptional 70.5% |
| Immigrants | Sri Lanka | 99.9 /100 | #36 | Exceptional 70.5% |
| Immigrants | Saudi Arabia | 99.9 /100 | #37 | Exceptional 70.4% |
| Australians | 99.9 /100 | #38 | Exceptional 70.4% |
| Bhutanese | 99.9 /100 | #39 | Exceptional 70.3% |
| Immigrants | Turkey | 99.9 /100 | #40 | Exceptional 70.3% |
| Immigrants | Kuwait | 99.9 /100 | #41 | Exceptional 70.3% |
| Immigrants | Lithuania | 99.9 /100 | #42 | Exceptional 70.3% |
| Israelis | 99.9 /100 | #43 | Exceptional 70.2% |
| New Zealanders | 99.9 /100 | #44 | Exceptional 70.2% |
| Immigrants | Norway | 99.9 /100 | #45 | Exceptional 70.2% |
| Immigrants | Latvia | 99.9 /100 | #46 | Exceptional 70.1% |
| Immigrants | Bulgaria | 99.8 /100 | #47 | Exceptional 70.0% |
| Immigrants | Netherlands | 99.8 /100 | #48 | Exceptional 70.0% |
| Immigrants | Austria | 99.8 /100 | #49 | Exceptional 70.0% |
| Zimbabweans | 99.8 /100 | #50 | Exceptional 69.9% |