Swedish vs Comanche GED/Equivalency
COMPARE
Swedish
Comanche
GED/Equivalency
GED/Equivalency Comparison
Swedes
Comanche
88.8%
GED/EQUIVALENCY
99.9/ 100
METRIC RATING
19th/ 347
METRIC RANK
83.6%
GED/EQUIVALENCY
0.7/ 100
METRIC RATING
253rd/ 347
METRIC RANK
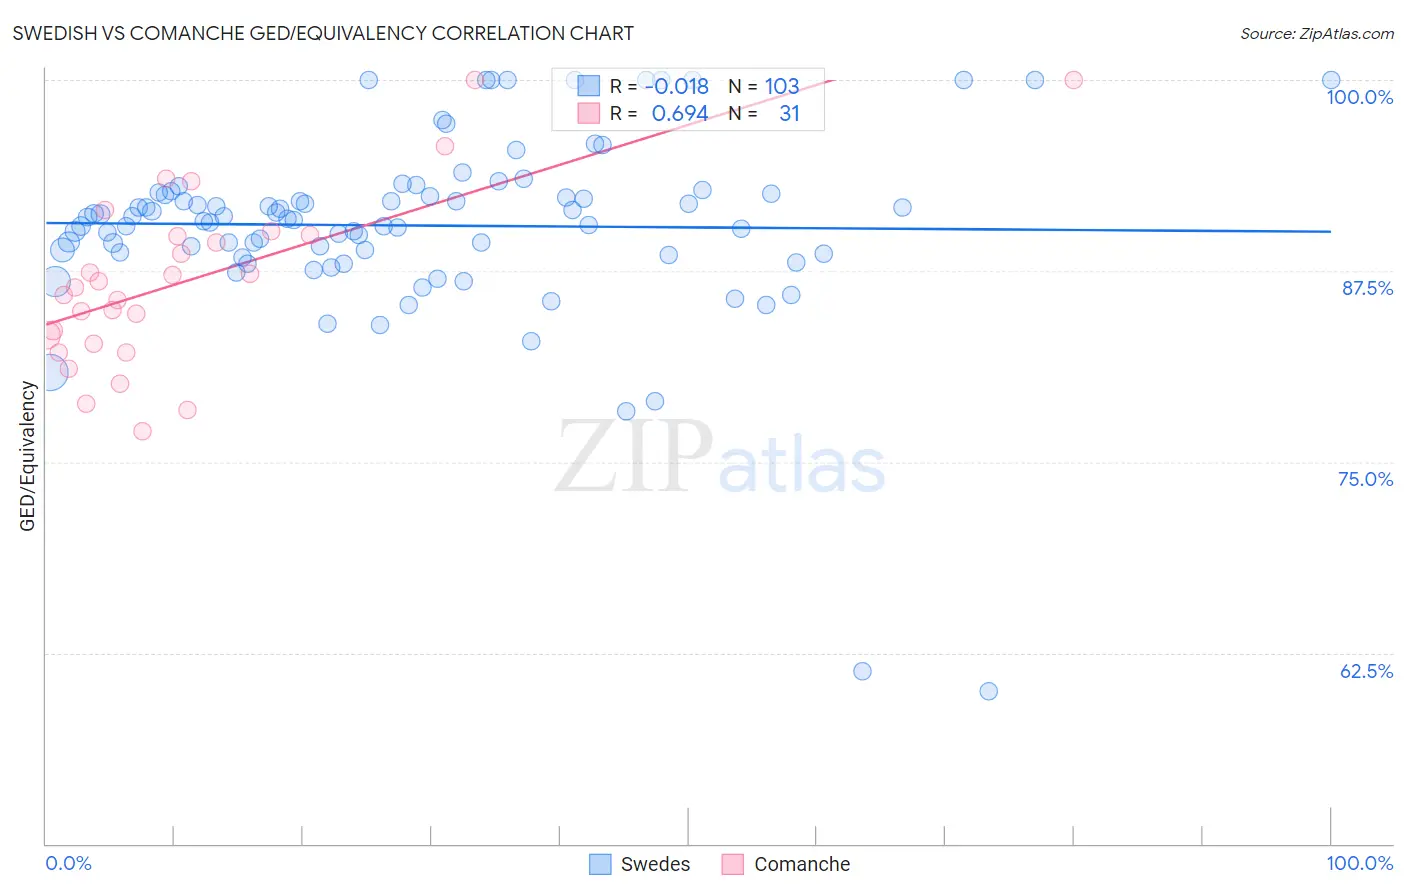
Swedish vs Comanche GED/Equivalency Correlation Chart
The statistical analysis conducted on geographies consisting of 539,231,677 people shows no correlation between the proportion of Swedes and percentage of population with at least ged/equivalency education in the United States with a correlation coefficient (R) of -0.018 and weighted average of 88.8%. Similarly, the statistical analysis conducted on geographies consisting of 109,786,530 people shows a significant positive correlation between the proportion of Comanche and percentage of population with at least ged/equivalency education in the United States with a correlation coefficient (R) of 0.694 and weighted average of 83.6%, a difference of 6.2%.
GED/Equivalency Correlation Summary
| Measurement | Swedish | Comanche |
| Minimum | 60.0% | 77.0% |
| Maximum | 100.0% | 100.0% |
| Range | 40.0% | 23.0% |
| Mean | 90.5% | 86.9% |
| Median | 90.9% | 86.4% |
| Interquartile 25% (IQ1) | 88.6% | 82.8% |
| Interquartile 75% (IQ3) | 92.6% | 89.8% |
| Interquartile Range (IQR) | 4.0% | 7.1% |
| Standard Deviation (Sample) | 6.1% | 5.7% |
| Standard Deviation (Population) | 6.1% | 5.6% |
Similar Demographics by GED/Equivalency
Demographics Similar to Swedes by GED/Equivalency
In terms of ged/equivalency, the demographic groups most similar to Swedes are Slovene (88.8%, a difference of 0.050%), Croatian (88.8%, a difference of 0.080%), Immigrants from Taiwan (88.8%, a difference of 0.11%), Okinawan (88.9%, a difference of 0.14%), and Maltese (88.6%, a difference of 0.15%).
| Demographics | Rating | Rank | GED/Equivalency |
| Lithuanians | 99.9 /100 | #12 | Exceptional 88.9% |
| Immigrants | Iran | 99.9 /100 | #13 | Exceptional 88.9% |
| Cypriots | 99.9 /100 | #14 | Exceptional 88.9% |
| Okinawans | 99.9 /100 | #15 | Exceptional 88.9% |
| Immigrants | Taiwan | 99.9 /100 | #16 | Exceptional 88.8% |
| Croatians | 99.9 /100 | #17 | Exceptional 88.8% |
| Slovenes | 99.9 /100 | #18 | Exceptional 88.8% |
| Swedes | 99.9 /100 | #19 | Exceptional 88.8% |
| Maltese | 99.9 /100 | #20 | Exceptional 88.6% |
| Luxembourgers | 99.8 /100 | #21 | Exceptional 88.6% |
| Immigrants | Ireland | 99.8 /100 | #22 | Exceptional 88.6% |
| Russians | 99.8 /100 | #23 | Exceptional 88.6% |
| Slovaks | 99.8 /100 | #24 | Exceptional 88.6% |
| Estonians | 99.8 /100 | #25 | Exceptional 88.6% |
| Immigrants | Australia | 99.8 /100 | #26 | Exceptional 88.6% |
Demographics Similar to Comanche by GED/Equivalency
In terms of ged/equivalency, the demographic groups most similar to Comanche are Creek (83.6%, a difference of 0.030%), Spanish American (83.6%, a difference of 0.060%), Bahamian (83.6%, a difference of 0.060%), Colville (83.4%, a difference of 0.20%), and African (83.4%, a difference of 0.20%).
| Demographics | Rating | Rank | GED/Equivalency |
| Chickasaw | 1.2 /100 | #246 | Tragic 83.8% |
| Immigrants | Western Africa | 1.1 /100 | #247 | Tragic 83.8% |
| Blackfeet | 1.1 /100 | #248 | Tragic 83.8% |
| Crow | 1.1 /100 | #249 | Tragic 83.8% |
| Shoshone | 1.0 /100 | #250 | Tragic 83.7% |
| Spanish Americans | 0.8 /100 | #251 | Tragic 83.6% |
| Bahamians | 0.8 /100 | #252 | Tragic 83.6% |
| Comanche | 0.7 /100 | #253 | Tragic 83.6% |
| Creek | 0.7 /100 | #254 | Tragic 83.6% |
| Colville | 0.5 /100 | #255 | Tragic 83.4% |
| Africans | 0.5 /100 | #256 | Tragic 83.4% |
| Jamaicans | 0.4 /100 | #257 | Tragic 83.3% |
| Malaysians | 0.4 /100 | #258 | Tragic 83.3% |
| Immigrants | Vietnam | 0.3 /100 | #259 | Tragic 83.2% |
| Choctaw | 0.3 /100 | #260 | Tragic 83.1% |