Central American Indian vs Chippewa Doctorate Degree
COMPARE
Central American Indian
Chippewa
Doctorate Degree
Doctorate Degree Comparison
Central American Indians
Chippewa
1.5%
DOCTORATE DEGREE
1.0/ 100
METRIC RATING
256th/ 347
METRIC RANK
1.5%
DOCTORATE DEGREE
0.9/ 100
METRIC RATING
257th/ 347
METRIC RANK
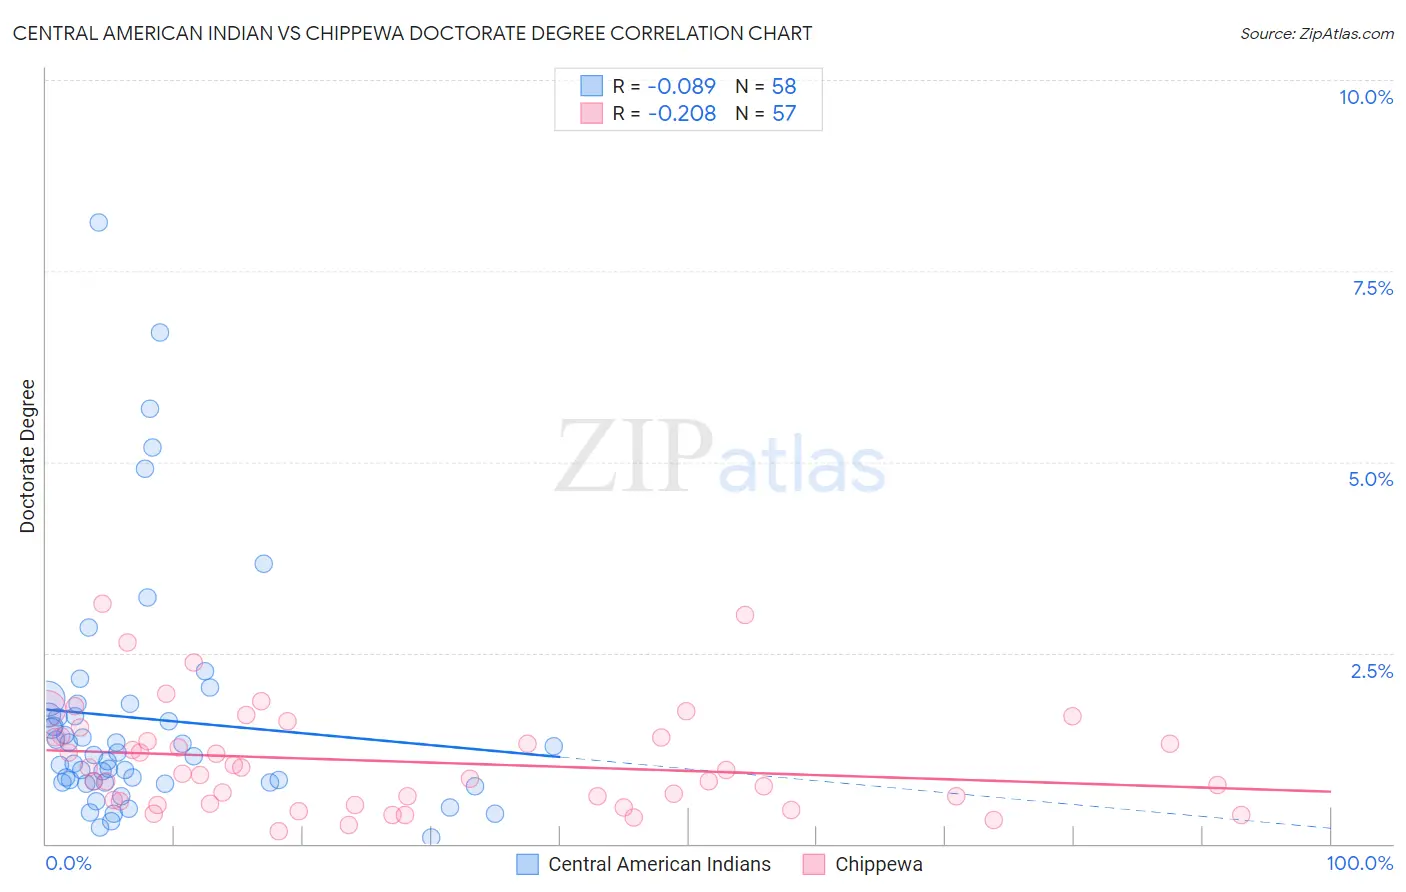
Central American Indian vs Chippewa Doctorate Degree Correlation Chart
The statistical analysis conducted on geographies consisting of 323,048,918 people shows a slight negative correlation between the proportion of Central American Indians and percentage of population with at least doctorate degree education in the United States with a correlation coefficient (R) of -0.089 and weighted average of 1.5%. Similarly, the statistical analysis conducted on geographies consisting of 212,158,664 people shows a weak negative correlation between the proportion of Chippewa and percentage of population with at least doctorate degree education in the United States with a correlation coefficient (R) of -0.208 and weighted average of 1.5%, a difference of 0.22%.
Doctorate Degree Correlation Summary
| Measurement | Central American Indian | Chippewa |
| Minimum | 0.089% | 0.17% |
| Maximum | 8.1% | 3.1% |
| Range | 8.0% | 3.0% |
| Mean | 1.6% | 1.1% |
| Median | 1.2% | 0.91% |
| Interquartile 25% (IQ1) | 0.81% | 0.54% |
| Interquartile 75% (IQ3) | 1.7% | 1.4% |
| Interquartile Range (IQR) | 0.88% | 0.86% |
| Standard Deviation (Sample) | 1.6% | 0.67% |
| Standard Deviation (Population) | 1.6% | 0.67% |
Demographics Similar to Central American Indians and Chippewa by Doctorate Degree
In terms of doctorate degree, the demographic groups most similar to Central American Indians are Immigrants from Cambodia (1.5%, a difference of 0.050%), Trinidadian and Tobagonian (1.5%, a difference of 0.050%), American (1.5%, a difference of 0.18%), Yuman (1.5%, a difference of 0.33%), and Immigrants from West Indies (1.5%, a difference of 0.48%). Similarly, the demographic groups most similar to Chippewa are Immigrants from West Indies (1.5%, a difference of 0.26%), Immigrants from Cambodia (1.5%, a difference of 0.27%), Trinidadian and Tobagonian (1.5%, a difference of 0.27%), Liberian (1.5%, a difference of 0.28%), and Japanese (1.5%, a difference of 0.38%).
| Demographics | Rating | Rank | Doctorate Degree |
| Hmong | 1.8 /100 | #246 | Tragic 1.6% |
| Comanche | 1.8 /100 | #247 | Tragic 1.6% |
| Africans | 1.8 /100 | #248 | Tragic 1.6% |
| Potawatomi | 1.6 /100 | #249 | Tragic 1.6% |
| Immigrants | Fiji | 1.6 /100 | #250 | Tragic 1.6% |
| Apache | 1.3 /100 | #251 | Tragic 1.5% |
| Yuman | 1.1 /100 | #252 | Tragic 1.5% |
| Americans | 1.0 /100 | #253 | Tragic 1.5% |
| Immigrants | Cambodia | 1.0 /100 | #254 | Tragic 1.5% |
| Trinidadians and Tobagonians | 1.0 /100 | #255 | Tragic 1.5% |
| Central American Indians | 1.0 /100 | #256 | Tragic 1.5% |
| Chippewa | 0.9 /100 | #257 | Tragic 1.5% |
| Immigrants | West Indies | 0.9 /100 | #258 | Tragic 1.5% |
| Liberians | 0.9 /100 | #259 | Tragic 1.5% |
| Japanese | 0.9 /100 | #260 | Tragic 1.5% |
| Immigrants | Portugal | 0.8 /100 | #261 | Tragic 1.5% |
| Chickasaw | 0.7 /100 | #262 | Tragic 1.5% |
| Immigrants | Bahamas | 0.7 /100 | #263 | Tragic 1.5% |
| Blackfeet | 0.7 /100 | #264 | Tragic 1.5% |
| Nicaraguans | 0.6 /100 | #265 | Tragic 1.5% |
| Immigrants | Liberia | 0.5 /100 | #266 | Tragic 1.5% |