Central American Indian vs Immigrants from Ukraine Doctorate Degree
COMPARE
Central American Indian
Immigrants from Ukraine
Doctorate Degree
Doctorate Degree Comparison
Central American Indians
Immigrants from Ukraine
1.5%
DOCTORATE DEGREE
1.0/ 100
METRIC RATING
256th/ 347
METRIC RANK
2.0%
DOCTORATE DEGREE
90.5/ 100
METRIC RATING
130th/ 347
METRIC RANK
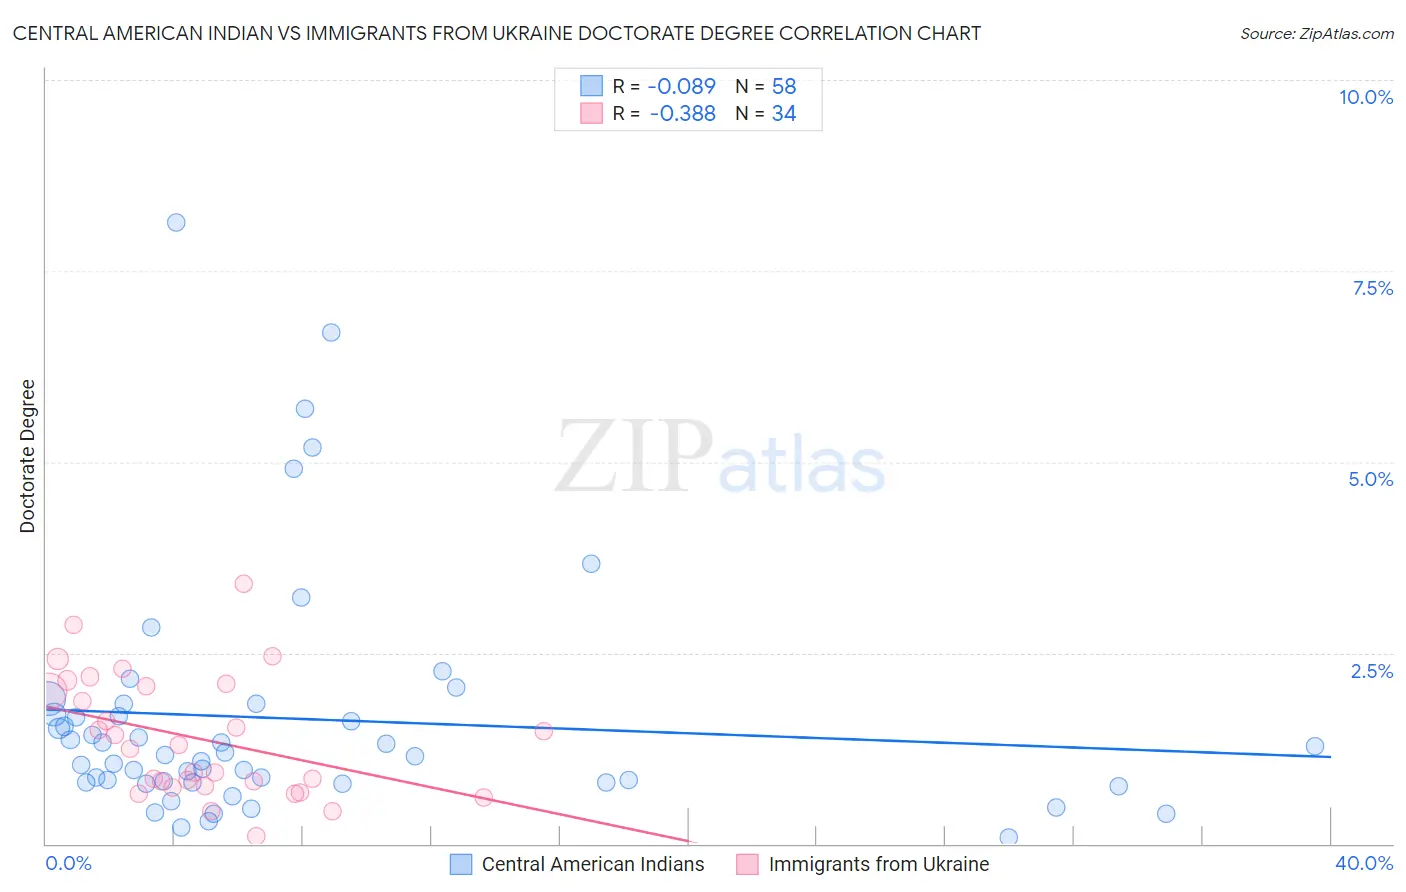
Central American Indian vs Immigrants from Ukraine Doctorate Degree Correlation Chart
The statistical analysis conducted on geographies consisting of 323,048,918 people shows a slight negative correlation between the proportion of Central American Indians and percentage of population with at least doctorate degree education in the United States with a correlation coefficient (R) of -0.089 and weighted average of 1.5%. Similarly, the statistical analysis conducted on geographies consisting of 288,420,787 people shows a mild negative correlation between the proportion of Immigrants from Ukraine and percentage of population with at least doctorate degree education in the United States with a correlation coefficient (R) of -0.388 and weighted average of 2.0%, a difference of 30.3%.
Doctorate Degree Correlation Summary
| Measurement | Central American Indian | Immigrants from Ukraine |
| Minimum | 0.089% | 0.095% |
| Maximum | 8.1% | 3.4% |
| Range | 8.0% | 3.3% |
| Mean | 1.6% | 1.4% |
| Median | 1.2% | 1.3% |
| Interquartile 25% (IQ1) | 0.81% | 0.75% |
| Interquartile 75% (IQ3) | 1.7% | 2.1% |
| Interquartile Range (IQR) | 0.88% | 1.3% |
| Standard Deviation (Sample) | 1.6% | 0.79% |
| Standard Deviation (Population) | 1.6% | 0.78% |
Similar Demographics by Doctorate Degree
Demographics Similar to Central American Indians by Doctorate Degree
In terms of doctorate degree, the demographic groups most similar to Central American Indians are Immigrants from Cambodia (1.5%, a difference of 0.050%), Trinidadian and Tobagonian (1.5%, a difference of 0.050%), American (1.5%, a difference of 0.18%), Chippewa (1.5%, a difference of 0.22%), and Yuman (1.5%, a difference of 0.33%).
| Demographics | Rating | Rank | Doctorate Degree |
| Potawatomi | 1.6 /100 | #249 | Tragic 1.6% |
| Immigrants | Fiji | 1.6 /100 | #250 | Tragic 1.6% |
| Apache | 1.3 /100 | #251 | Tragic 1.5% |
| Yuman | 1.1 /100 | #252 | Tragic 1.5% |
| Americans | 1.0 /100 | #253 | Tragic 1.5% |
| Immigrants | Cambodia | 1.0 /100 | #254 | Tragic 1.5% |
| Trinidadians and Tobagonians | 1.0 /100 | #255 | Tragic 1.5% |
| Central American Indians | 1.0 /100 | #256 | Tragic 1.5% |
| Chippewa | 0.9 /100 | #257 | Tragic 1.5% |
| Immigrants | West Indies | 0.9 /100 | #258 | Tragic 1.5% |
| Liberians | 0.9 /100 | #259 | Tragic 1.5% |
| Japanese | 0.9 /100 | #260 | Tragic 1.5% |
| Immigrants | Portugal | 0.8 /100 | #261 | Tragic 1.5% |
| Chickasaw | 0.7 /100 | #262 | Tragic 1.5% |
| Immigrants | Bahamas | 0.7 /100 | #263 | Tragic 1.5% |
Demographics Similar to Immigrants from Ukraine by Doctorate Degree
In terms of doctorate degree, the demographic groups most similar to Immigrants from Ukraine are Canadian (2.0%, a difference of 0.010%), Immigrants from Sierra Leone (2.0%, a difference of 0.14%), Immigrants from Zaire (2.0%, a difference of 0.22%), Scottish (2.0%, a difference of 0.41%), and Immigrants from Uzbekistan (2.0%, a difference of 0.46%).
| Demographics | Rating | Rank | Doctorate Degree |
| Croatians | 94.0 /100 | #123 | Exceptional 2.0% |
| Ute | 93.2 /100 | #124 | Exceptional 2.0% |
| Moroccans | 93.0 /100 | #125 | Exceptional 2.0% |
| Jordanians | 92.1 /100 | #126 | Exceptional 2.0% |
| Palestinians | 92.0 /100 | #127 | Exceptional 2.0% |
| Immigrants | Zaire | 91.1 /100 | #128 | Exceptional 2.0% |
| Canadians | 90.6 /100 | #129 | Exceptional 2.0% |
| Immigrants | Ukraine | 90.5 /100 | #130 | Exceptional 2.0% |
| Immigrants | Sierra Leone | 90.2 /100 | #131 | Exceptional 2.0% |
| Scottish | 89.4 /100 | #132 | Excellent 2.0% |
| Immigrants | Uzbekistan | 89.3 /100 | #133 | Excellent 2.0% |
| Immigrants | Cameroon | 88.9 /100 | #134 | Excellent 2.0% |
| Serbians | 88.7 /100 | #135 | Excellent 2.0% |
| Swedes | 88.3 /100 | #136 | Excellent 2.0% |
| South American Indians | 88.3 /100 | #137 | Excellent 2.0% |