Immigrants from Yemen vs Somali 6th Grade
COMPARE
Immigrants from Yemen
Somali
6th Grade
6th Grade Comparison
Immigrants from Yemen
Somalis
94.1%
6TH GRADE
0.0/ 100
METRIC RATING
341st/ 347
METRIC RANK
96.2%
6TH GRADE
0.1/ 100
METRIC RATING
285th/ 347
METRIC RANK
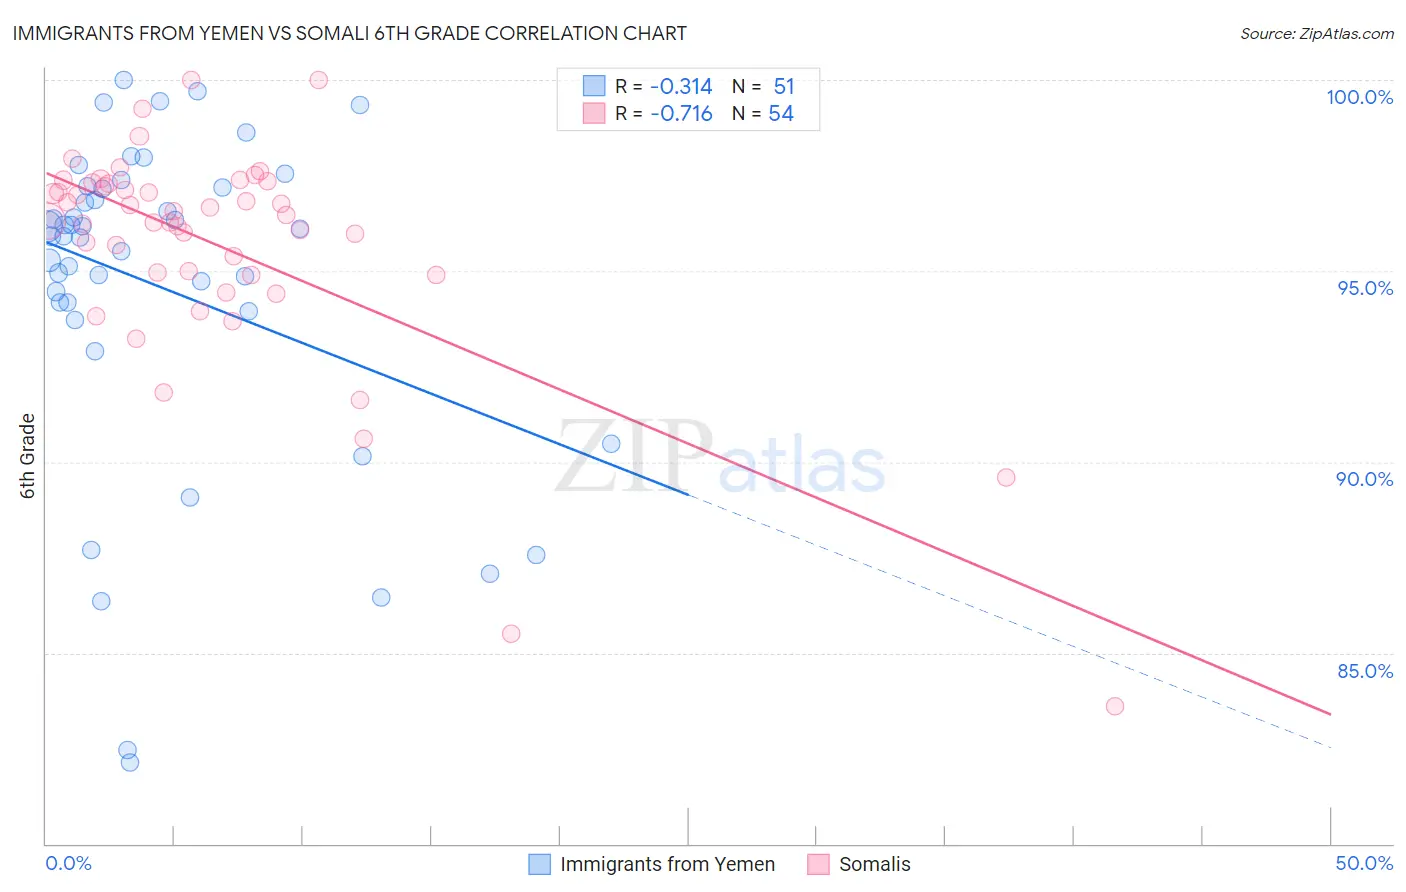
Immigrants from Yemen vs Somali 6th Grade Correlation Chart
The statistical analysis conducted on geographies consisting of 82,433,611 people shows a mild negative correlation between the proportion of Immigrants from Yemen and percentage of population with at least 6th grade education in the United States with a correlation coefficient (R) of -0.314 and weighted average of 94.1%. Similarly, the statistical analysis conducted on geographies consisting of 99,332,457 people shows a strong negative correlation between the proportion of Somalis and percentage of population with at least 6th grade education in the United States with a correlation coefficient (R) of -0.716 and weighted average of 96.2%, a difference of 2.2%.
6th Grade Correlation Summary
| Measurement | Immigrants from Yemen | Somali |
| Minimum | 82.1% | 83.6% |
| Maximum | 100.0% | 100.0% |
| Range | 17.9% | 16.4% |
| Mean | 94.6% | 95.6% |
| Median | 95.9% | 96.4% |
| Interquartile 25% (IQ1) | 93.9% | 94.9% |
| Interquartile 75% (IQ3) | 97.2% | 97.3% |
| Interquartile Range (IQR) | 3.2% | 2.4% |
| Standard Deviation (Sample) | 4.3% | 3.0% |
| Standard Deviation (Population) | 4.2% | 3.0% |
Similar Demographics by 6th Grade
Demographics Similar to Immigrants from Yemen by 6th Grade
In terms of 6th grade, the demographic groups most similar to Immigrants from Yemen are Immigrants from Central America (94.0%, a difference of 0.10%), Guatemalan (94.2%, a difference of 0.11%), Immigrants from Mexico (93.9%, a difference of 0.16%), Immigrants from Guatemala (93.9%, a difference of 0.17%), and Salvadoran (93.9%, a difference of 0.17%).
| Demographics | Rating | Rank | 6th Grade |
| Immigrants | Latin America | 0.0 /100 | #333 | Tragic 94.7% |
| Immigrants | Azores | 0.0 /100 | #334 | Tragic 94.7% |
| Mexicans | 0.0 /100 | #335 | Tragic 94.6% |
| Immigrants | Dominican Republic | 0.0 /100 | #336 | Tragic 94.6% |
| Central Americans | 0.0 /100 | #337 | Tragic 94.5% |
| Immigrants | Cabo Verde | 0.0 /100 | #338 | Tragic 94.4% |
| Yakama | 0.0 /100 | #339 | Tragic 94.3% |
| Guatemalans | 0.0 /100 | #340 | Tragic 94.2% |
| Immigrants | Yemen | 0.0 /100 | #341 | Tragic 94.1% |
| Immigrants | Central America | 0.0 /100 | #342 | Tragic 94.0% |
| Immigrants | Mexico | 0.0 /100 | #343 | Tragic 93.9% |
| Immigrants | Guatemala | 0.0 /100 | #344 | Tragic 93.9% |
| Salvadorans | 0.0 /100 | #345 | Tragic 93.9% |
| Spanish American Indians | 0.0 /100 | #346 | Tragic 93.6% |
| Immigrants | El Salvador | 0.0 /100 | #347 | Tragic 93.6% |
Demographics Similar to Somalis by 6th Grade
In terms of 6th grade, the demographic groups most similar to Somalis are Fijian (96.2%, a difference of 0.010%), Cuban (96.2%, a difference of 0.020%), Immigrants from Afghanistan (96.2%, a difference of 0.030%), Trinidadian and Tobagonian (96.2%, a difference of 0.030%), and Houma (96.2%, a difference of 0.030%).
| Demographics | Rating | Rank | 6th Grade |
| Immigrants | Thailand | 0.1 /100 | #278 | Tragic 96.3% |
| Immigrants | Peru | 0.1 /100 | #279 | Tragic 96.2% |
| Immigrants | Afghanistan | 0.1 /100 | #280 | Tragic 96.2% |
| Trinidadians and Tobagonians | 0.1 /100 | #281 | Tragic 96.2% |
| Houma | 0.1 /100 | #282 | Tragic 96.2% |
| Cubans | 0.1 /100 | #283 | Tragic 96.2% |
| Fijians | 0.1 /100 | #284 | Tragic 96.2% |
| Somalis | 0.1 /100 | #285 | Tragic 96.2% |
| Barbadians | 0.0 /100 | #286 | Tragic 96.2% |
| Immigrants | Trinidad and Tobago | 0.0 /100 | #287 | Tragic 96.2% |
| Malaysians | 0.0 /100 | #288 | Tragic 96.2% |
| Immigrants | Eritrea | 0.0 /100 | #289 | Tragic 96.1% |
| Immigrants | Somalia | 0.0 /100 | #290 | Tragic 96.1% |
| Immigrants | St. Vincent and the Grenadines | 0.0 /100 | #291 | Tragic 96.1% |
| Immigrants | Barbados | 0.0 /100 | #292 | Tragic 96.1% |