Moroccan vs Immigrants from Guyana 6th Grade
COMPARE
Moroccan
Immigrants from Guyana
6th Grade
6th Grade Comparison
Moroccans
Immigrants from Guyana
96.8%
6TH GRADE
9.0/ 100
METRIC RATING
212th/ 347
METRIC RANK
95.5%
6TH GRADE
0.0/ 100
METRIC RATING
312th/ 347
METRIC RANK
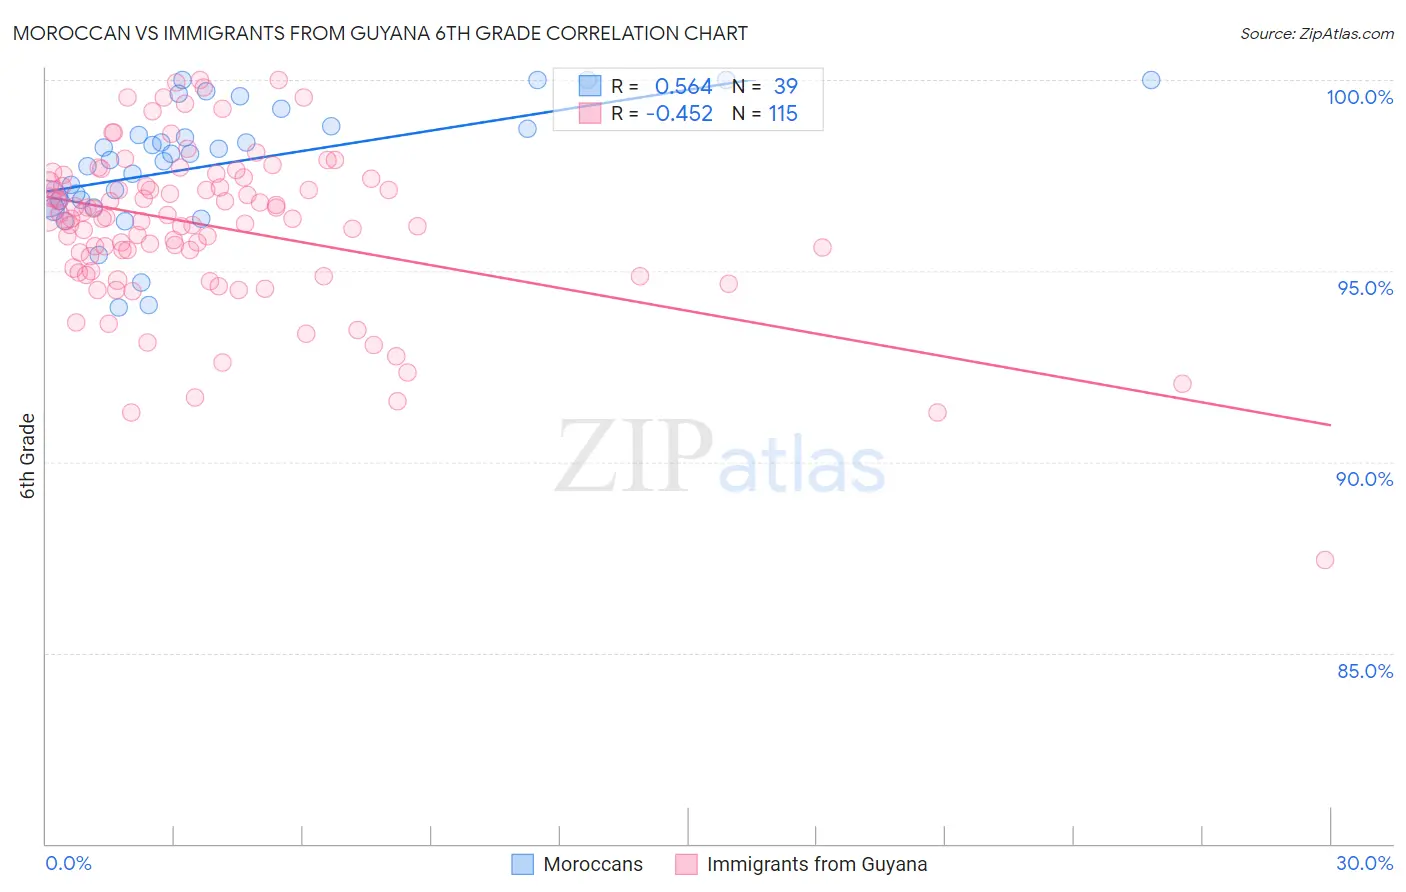
Moroccan vs Immigrants from Guyana 6th Grade Correlation Chart
The statistical analysis conducted on geographies consisting of 201,817,667 people shows a substantial positive correlation between the proportion of Moroccans and percentage of population with at least 6th grade education in the United States with a correlation coefficient (R) of 0.564 and weighted average of 96.8%. Similarly, the statistical analysis conducted on geographies consisting of 183,673,461 people shows a moderate negative correlation between the proportion of Immigrants from Guyana and percentage of population with at least 6th grade education in the United States with a correlation coefficient (R) of -0.452 and weighted average of 95.5%, a difference of 1.4%.
6th Grade Correlation Summary
| Measurement | Moroccan | Immigrants from Guyana |
| Minimum | 94.0% | 87.4% |
| Maximum | 100.0% | 100.0% |
| Range | 6.0% | 12.6% |
| Mean | 97.8% | 96.2% |
| Median | 98.1% | 96.4% |
| Interquartile 25% (IQ1) | 96.9% | 95.0% |
| Interquartile 75% (IQ3) | 98.8% | 97.3% |
| Interquartile Range (IQR) | 1.9% | 2.3% |
| Standard Deviation (Sample) | 1.6% | 2.1% |
| Standard Deviation (Population) | 1.6% | 2.1% |
Similar Demographics by 6th Grade
Demographics Similar to Moroccans by 6th Grade
In terms of 6th grade, the demographic groups most similar to Moroccans are Immigrants from Iraq (96.8%, a difference of 0.0%), Immigrants from Sudan (96.8%, a difference of 0.0%), Portuguese (96.8%, a difference of 0.010%), Sierra Leonean (96.8%, a difference of 0.010%), and Immigrants from Nepal (96.8%, a difference of 0.020%).
| Demographics | Rating | Rank | 6th Grade |
| Natives/Alaskans | 13.0 /100 | #205 | Poor 96.8% |
| Laotians | 11.8 /100 | #206 | Poor 96.8% |
| Iraqis | 11.7 /100 | #207 | Poor 96.8% |
| Samoans | 11.0 /100 | #208 | Poor 96.8% |
| Immigrants | Oceania | 11.0 /100 | #209 | Poor 96.8% |
| Immigrants | Nepal | 10.1 /100 | #210 | Poor 96.8% |
| Immigrants | Iraq | 9.2 /100 | #211 | Tragic 96.8% |
| Moroccans | 9.0 /100 | #212 | Tragic 96.8% |
| Immigrants | Sudan | 8.7 /100 | #213 | Tragic 96.8% |
| Portuguese | 8.2 /100 | #214 | Tragic 96.8% |
| Sierra Leoneans | 8.0 /100 | #215 | Tragic 96.8% |
| Paiute | 7.8 /100 | #216 | Tragic 96.8% |
| Liberians | 7.5 /100 | #217 | Tragic 96.8% |
| Navajo | 7.3 /100 | #218 | Tragic 96.8% |
| Costa Ricans | 6.8 /100 | #219 | Tragic 96.8% |
Demographics Similar to Immigrants from Guyana by 6th Grade
In terms of 6th grade, the demographic groups most similar to Immigrants from Guyana are Immigrants from Portugal (95.5%, a difference of 0.010%), Ecuadorian (95.5%, a difference of 0.030%), Puerto Rican (95.5%, a difference of 0.040%), Immigrants from Caribbean (95.6%, a difference of 0.090%), and Nicaraguan (95.4%, a difference of 0.090%).
| Demographics | Rating | Rank | 6th Grade |
| Immigrants | Cuba | 0.0 /100 | #305 | Tragic 95.6% |
| Immigrants | Haiti | 0.0 /100 | #306 | Tragic 95.6% |
| Guyanese | 0.0 /100 | #307 | Tragic 95.6% |
| Immigrants | Caribbean | 0.0 /100 | #308 | Tragic 95.6% |
| Puerto Ricans | 0.0 /100 | #309 | Tragic 95.5% |
| Ecuadorians | 0.0 /100 | #310 | Tragic 95.5% |
| Immigrants | Portugal | 0.0 /100 | #311 | Tragic 95.5% |
| Immigrants | Guyana | 0.0 /100 | #312 | Tragic 95.5% |
| Nicaraguans | 0.0 /100 | #313 | Tragic 95.4% |
| Immigrants | Vietnam | 0.0 /100 | #314 | Tragic 95.4% |
| Immigrants | Bangladesh | 0.0 /100 | #315 | Tragic 95.4% |
| Japanese | 0.0 /100 | #316 | Tragic 95.4% |
| Vietnamese | 0.0 /100 | #317 | Tragic 95.3% |
| Belizeans | 0.0 /100 | #318 | Tragic 95.3% |
| Immigrants | Belize | 0.0 /100 | #319 | Tragic 95.3% |