Central American Indian vs Tohono O'odham 7th Grade
COMPARE
Central American Indian
Tohono O'odham
7th Grade
7th Grade Comparison
Central American Indians
Tohono O'odham
93.3%
7TH GRADE
0.0/ 100
METRIC RATING
325th/ 347
METRIC RANK
95.0%
7TH GRADE
0.1/ 100
METRIC RATING
281st/ 347
METRIC RANK
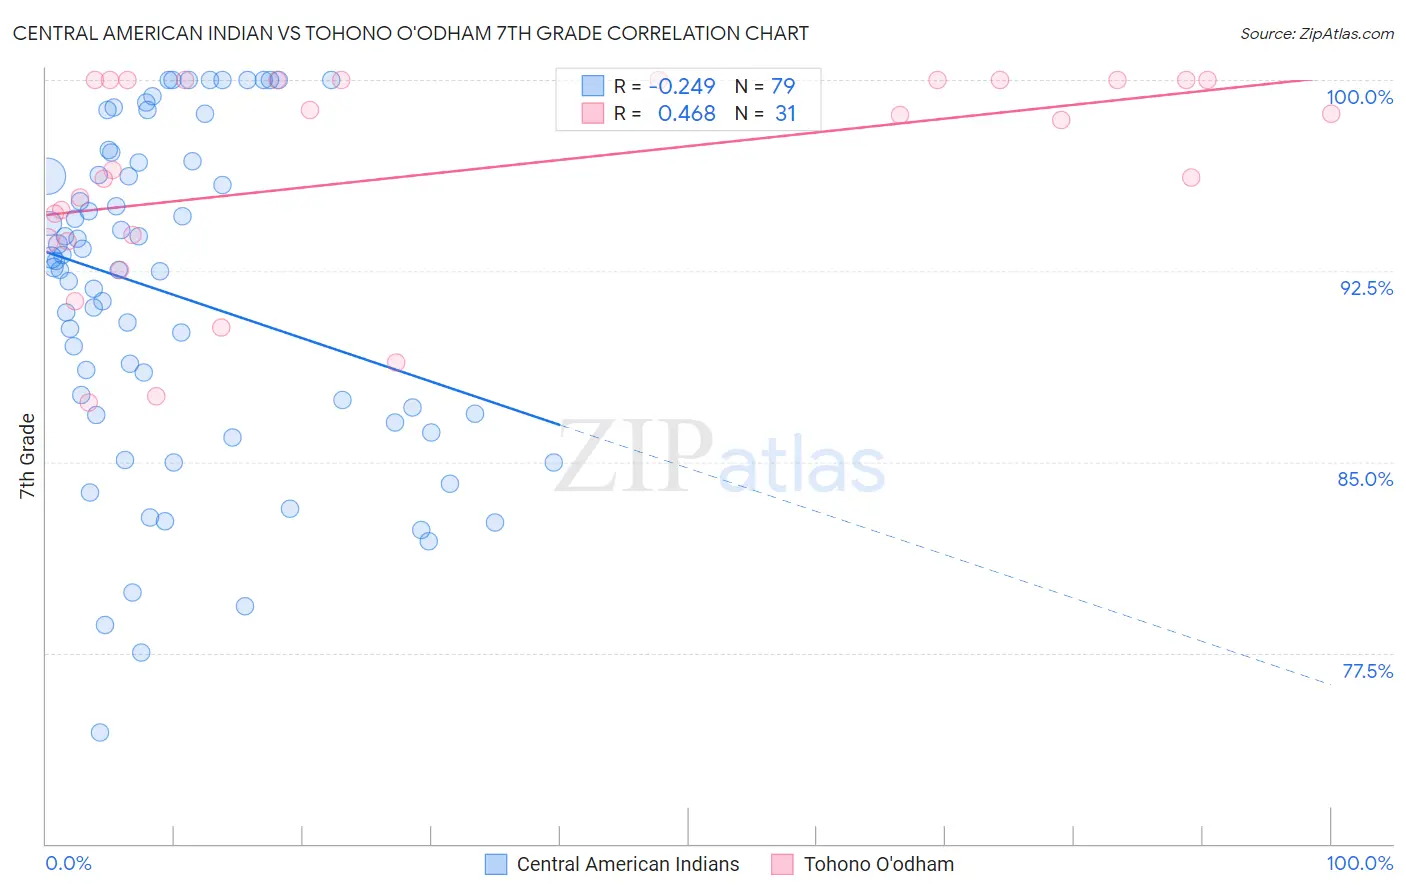
Central American Indian vs Tohono O'odham 7th Grade Correlation Chart
The statistical analysis conducted on geographies consisting of 326,142,643 people shows a weak negative correlation between the proportion of Central American Indians and percentage of population with at least 7th grade education in the United States with a correlation coefficient (R) of -0.249 and weighted average of 93.3%. Similarly, the statistical analysis conducted on geographies consisting of 58,730,615 people shows a moderate positive correlation between the proportion of Tohono O'odham and percentage of population with at least 7th grade education in the United States with a correlation coefficient (R) of 0.468 and weighted average of 95.0%, a difference of 1.9%.
7th Grade Correlation Summary
| Measurement | Central American Indian | Tohono O'odham |
| Minimum | 74.4% | 87.3% |
| Maximum | 100.0% | 100.0% |
| Range | 25.6% | 12.7% |
| Mean | 91.6% | 96.4% |
| Median | 92.6% | 98.4% |
| Interquartile 25% (IQ1) | 86.8% | 93.7% |
| Interquartile 75% (IQ3) | 96.8% | 100.0% |
| Interquartile Range (IQR) | 9.9% | 6.3% |
| Standard Deviation (Sample) | 6.4% | 4.1% |
| Standard Deviation (Population) | 6.4% | 4.0% |
Similar Demographics by 7th Grade
Demographics Similar to Central American Indians by 7th Grade
In terms of 7th grade, the demographic groups most similar to Central American Indians are Dominican (93.3%, a difference of 0.070%), Immigrants from Belize (93.4%, a difference of 0.080%), Nepalese (93.2%, a difference of 0.11%), Immigrants from Cabo Verde (93.1%, a difference of 0.18%), and Nicaraguan (93.5%, a difference of 0.20%).
| Demographics | Rating | Rank | 7th Grade |
| Immigrants | Ecuador | 0.0 /100 | #318 | Tragic 93.7% |
| Immigrants | Cambodia | 0.0 /100 | #319 | Tragic 93.7% |
| Immigrants | Fiji | 0.0 /100 | #320 | Tragic 93.5% |
| Belizeans | 0.0 /100 | #321 | Tragic 93.5% |
| Nicaraguans | 0.0 /100 | #322 | Tragic 93.5% |
| Immigrants | Belize | 0.0 /100 | #323 | Tragic 93.4% |
| Dominicans | 0.0 /100 | #324 | Tragic 93.3% |
| Central American Indians | 0.0 /100 | #325 | Tragic 93.3% |
| Nepalese | 0.0 /100 | #326 | Tragic 93.2% |
| Immigrants | Cabo Verde | 0.0 /100 | #327 | Tragic 93.1% |
| Immigrants | Nicaragua | 0.0 /100 | #328 | Tragic 93.0% |
| Immigrants | Azores | 0.0 /100 | #329 | Tragic 93.0% |
| Immigrants | Dominican Republic | 0.0 /100 | #330 | Tragic 92.9% |
| Hondurans | 0.0 /100 | #331 | Tragic 92.9% |
| Hispanics or Latinos | 0.0 /100 | #332 | Tragic 92.7% |
Demographics Similar to Tohono O'odham by 7th Grade
In terms of 7th grade, the demographic groups most similar to Tohono O'odham are Immigrants from St. Vincent and the Grenadines (95.0%, a difference of 0.0%), Immigrants from Bolivia (95.0%, a difference of 0.010%), Barbadian (95.1%, a difference of 0.030%), Immigrants from Trinidad and Tobago (95.1%, a difference of 0.040%), and Immigrants from Afghanistan (95.1%, a difference of 0.070%).
| Demographics | Rating | Rank | 7th Grade |
| Immigrants | Western Africa | 0.2 /100 | #274 | Tragic 95.1% |
| Immigrants | Colombia | 0.2 /100 | #275 | Tragic 95.1% |
| Immigrants | Thailand | 0.2 /100 | #276 | Tragic 95.1% |
| Immigrants | Afghanistan | 0.2 /100 | #277 | Tragic 95.1% |
| Immigrants | Trinidad and Tobago | 0.1 /100 | #278 | Tragic 95.1% |
| Barbadians | 0.1 /100 | #279 | Tragic 95.1% |
| Immigrants | St. Vincent and the Grenadines | 0.1 /100 | #280 | Tragic 95.0% |
| Tohono O'odham | 0.1 /100 | #281 | Tragic 95.0% |
| Immigrants | Bolivia | 0.1 /100 | #282 | Tragic 95.0% |
| Immigrants | Barbados | 0.1 /100 | #283 | Tragic 95.0% |
| Armenians | 0.1 /100 | #284 | Tragic 95.0% |
| Immigrants | Eritrea | 0.1 /100 | #285 | Tragic 94.9% |
| Immigrants | Philippines | 0.0 /100 | #286 | Tragic 94.9% |
| Immigrants | Peru | 0.0 /100 | #287 | Tragic 94.9% |
| British West Indians | 0.0 /100 | #288 | Tragic 94.8% |