Central American Indian vs Immigrants from Eastern Africa Householder Income Ages 25 - 44 years
COMPARE
Central American Indian
Immigrants from Eastern Africa
Householder Income Ages 25 - 44 years
Householder Income Ages 25 - 44 years Comparison
Central American Indians
Immigrants from Eastern Africa
$82,355
HOUSEHOLDER INCOME AGES 25 - 44 YEARS
0.1/ 100
METRIC RATING
282nd/ 347
METRIC RANK
$91,458
HOUSEHOLDER INCOME AGES 25 - 44 YEARS
15.2/ 100
METRIC RATING
205th/ 347
METRIC RANK
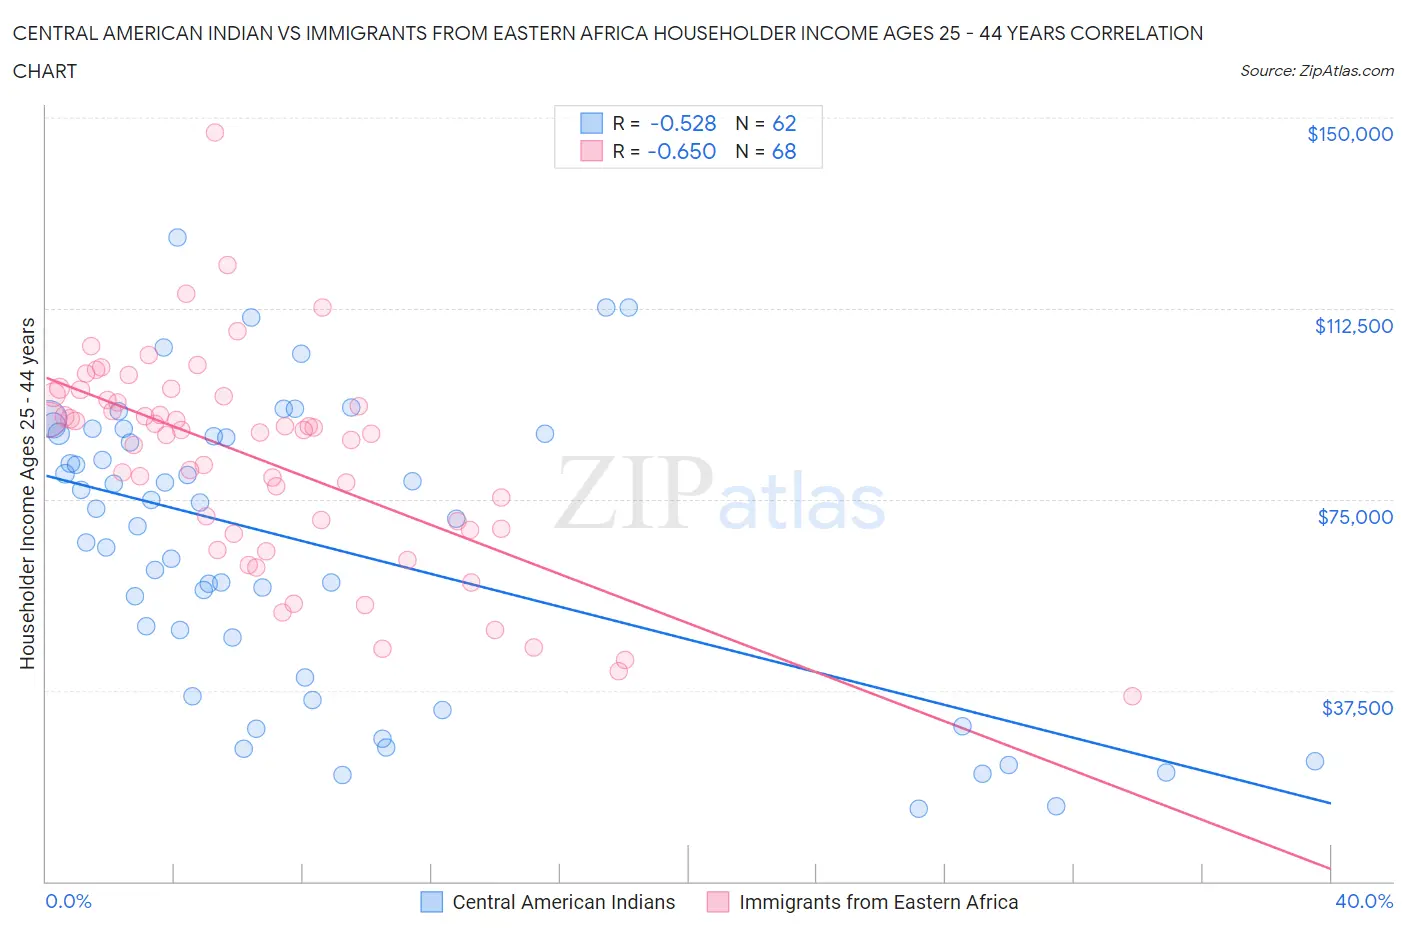
Central American Indian vs Immigrants from Eastern Africa Householder Income Ages 25 - 44 years Correlation Chart
The statistical analysis conducted on geographies consisting of 325,704,457 people shows a substantial negative correlation between the proportion of Central American Indians and household income with householder between the ages 25 and 44 in the United States with a correlation coefficient (R) of -0.528 and weighted average of $82,355. Similarly, the statistical analysis conducted on geographies consisting of 354,447,145 people shows a significant negative correlation between the proportion of Immigrants from Eastern Africa and household income with householder between the ages 25 and 44 in the United States with a correlation coefficient (R) of -0.650 and weighted average of $91,458, a difference of 11.1%.
Householder Income Ages 25 - 44 years Correlation Summary
| Measurement | Central American Indian | Immigrants from Eastern Africa |
| Minimum | $14,158 | $36,409 |
| Maximum | $126,501 | $146,936 |
| Range | $112,343 | $110,527 |
| Mean | $66,041 | $82,778 |
| Median | $72,238 | $88,339 |
| Interquartile 25% (IQ1) | $39,906 | $69,093 |
| Interquartile 75% (IQ3) | $87,781 | $94,875 |
| Interquartile Range (IQR) | $47,875 | $25,782 |
| Standard Deviation (Sample) | $28,438 | $20,521 |
| Standard Deviation (Population) | $28,208 | $20,370 |
Similar Demographics by Householder Income Ages 25 - 44 years
Demographics Similar to Central American Indians by Householder Income Ages 25 - 44 years
In terms of householder income ages 25 - 44 years, the demographic groups most similar to Central American Indians are Guatemalan ($82,331, a difference of 0.030%), Cajun ($82,393, a difference of 0.050%), Immigrants from Middle Africa ($82,254, a difference of 0.12%), Immigrants from Somalia ($82,188, a difference of 0.20%), and Ute ($82,166, a difference of 0.23%).
| Demographics | Rating | Rank | Householder Income Ages 25 - 44 years |
| Immigrants | Jamaica | 0.2 /100 | #275 | Tragic $83,298 |
| Immigrants | Belize | 0.2 /100 | #276 | Tragic $83,141 |
| Paiute | 0.2 /100 | #277 | Tragic $82,984 |
| Senegalese | 0.2 /100 | #278 | Tragic $82,852 |
| Pima | 0.1 /100 | #279 | Tragic $82,821 |
| Colville | 0.1 /100 | #280 | Tragic $82,604 |
| Cajuns | 0.1 /100 | #281 | Tragic $82,393 |
| Central American Indians | 0.1 /100 | #282 | Tragic $82,355 |
| Guatemalans | 0.1 /100 | #283 | Tragic $82,331 |
| Immigrants | Middle Africa | 0.1 /100 | #284 | Tragic $82,254 |
| Immigrants | Somalia | 0.1 /100 | #285 | Tragic $82,188 |
| Ute | 0.1 /100 | #286 | Tragic $82,166 |
| Immigrants | Latin America | 0.1 /100 | #287 | Tragic $82,166 |
| Comanche | 0.1 /100 | #288 | Tragic $82,152 |
| Shoshone | 0.1 /100 | #289 | Tragic $82,062 |
Demographics Similar to Immigrants from Eastern Africa by Householder Income Ages 25 - 44 years
In terms of householder income ages 25 - 44 years, the demographic groups most similar to Immigrants from Eastern Africa are Nepalese ($91,498, a difference of 0.040%), Immigrants from Cambodia ($91,533, a difference of 0.080%), Aleut ($91,370, a difference of 0.10%), Yugoslavian ($91,368, a difference of 0.10%), and Ecuadorian ($91,574, a difference of 0.13%).
| Demographics | Rating | Rank | Householder Income Ages 25 - 44 years |
| Vietnamese | 20.2 /100 | #198 | Fair $92,089 |
| Kenyans | 16.8 /100 | #199 | Poor $91,684 |
| Whites/Caucasians | 16.7 /100 | #200 | Poor $91,668 |
| Japanese | 16.4 /100 | #201 | Poor $91,624 |
| Ecuadorians | 16.0 /100 | #202 | Poor $91,574 |
| Immigrants | Cambodia | 15.7 /100 | #203 | Poor $91,533 |
| Nepalese | 15.4 /100 | #204 | Poor $91,498 |
| Immigrants | Eastern Africa | 15.2 /100 | #205 | Poor $91,458 |
| Aleuts | 14.5 /100 | #206 | Poor $91,370 |
| Yugoslavians | 14.5 /100 | #207 | Poor $91,368 |
| Immigrants | Thailand | 14.3 /100 | #208 | Poor $91,337 |
| Immigrants | Uruguay | 13.2 /100 | #209 | Poor $91,171 |
| Immigrants | Kenya | 10.9 /100 | #210 | Poor $90,767 |
| Iraqis | 10.8 /100 | #211 | Poor $90,764 |
| Hawaiians | 10.6 /100 | #212 | Poor $90,722 |