Central American Indian vs Yuman 7th Grade
COMPARE
Central American Indian
Yuman
7th Grade
7th Grade Comparison
Central American Indians
Yuman
93.3%
7TH GRADE
0.0/ 100
METRIC RATING
325th/ 347
METRIC RANK
95.2%
7TH GRADE
0.3/ 100
METRIC RATING
267th/ 347
METRIC RANK
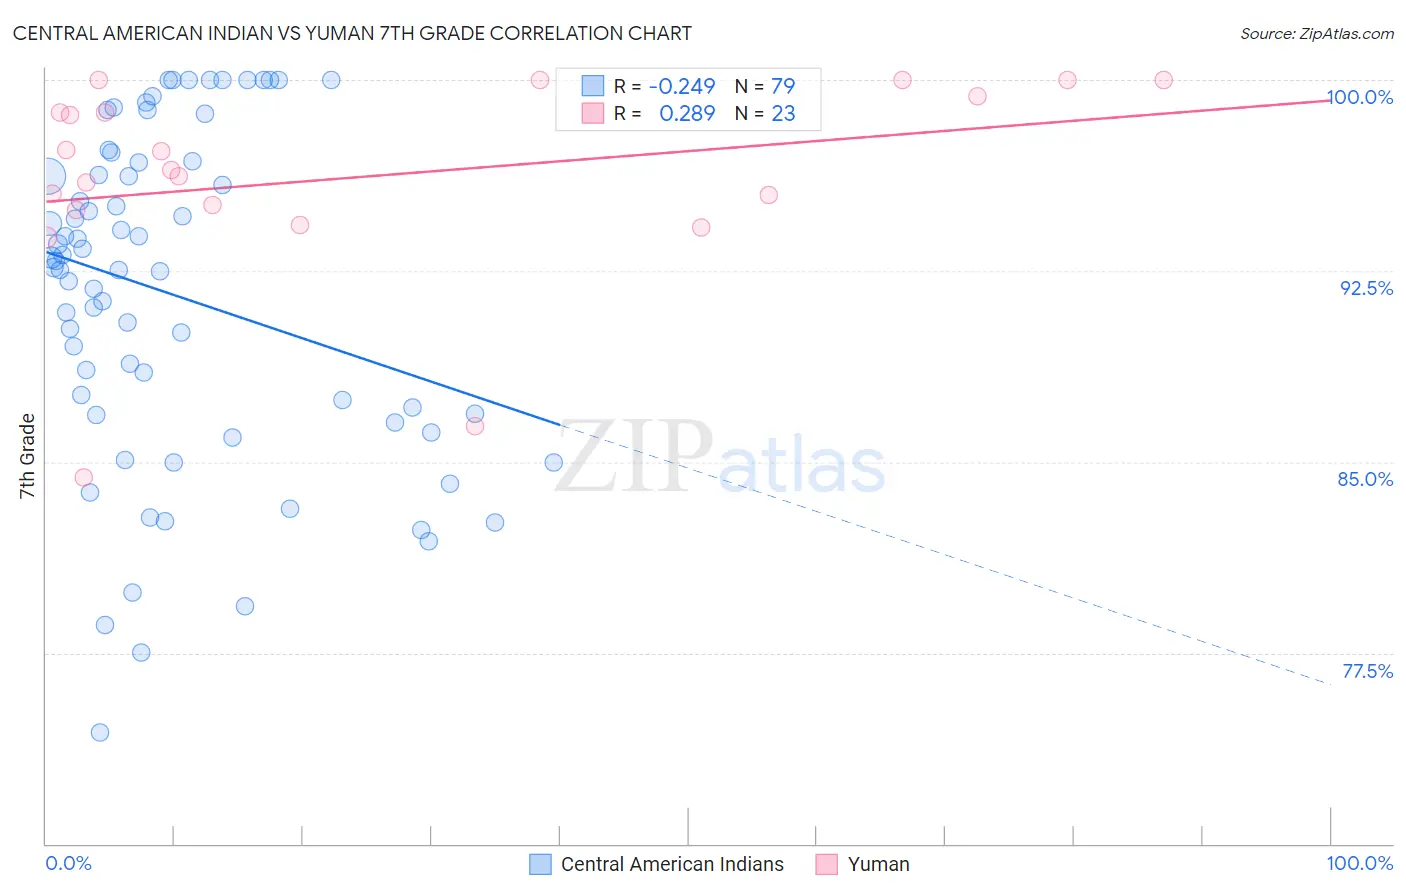
Central American Indian vs Yuman 7th Grade Correlation Chart
The statistical analysis conducted on geographies consisting of 326,142,643 people shows a weak negative correlation between the proportion of Central American Indians and percentage of population with at least 7th grade education in the United States with a correlation coefficient (R) of -0.249 and weighted average of 93.3%. Similarly, the statistical analysis conducted on geographies consisting of 40,696,349 people shows a weak positive correlation between the proportion of Yuman and percentage of population with at least 7th grade education in the United States with a correlation coefficient (R) of 0.289 and weighted average of 95.2%, a difference of 2.0%.
7th Grade Correlation Summary
| Measurement | Central American Indian | Yuman |
| Minimum | 74.4% | 84.4% |
| Maximum | 100.0% | 100.0% |
| Range | 25.6% | 15.6% |
| Mean | 91.6% | 96.2% |
| Median | 92.6% | 96.5% |
| Interquartile 25% (IQ1) | 86.8% | 94.9% |
| Interquartile 75% (IQ3) | 96.8% | 99.3% |
| Interquartile Range (IQR) | 9.9% | 4.4% |
| Standard Deviation (Sample) | 6.4% | 4.0% |
| Standard Deviation (Population) | 6.4% | 3.9% |
Similar Demographics by 7th Grade
Demographics Similar to Central American Indians by 7th Grade
In terms of 7th grade, the demographic groups most similar to Central American Indians are Dominican (93.3%, a difference of 0.070%), Immigrants from Belize (93.4%, a difference of 0.080%), Nepalese (93.2%, a difference of 0.11%), Immigrants from Cabo Verde (93.1%, a difference of 0.18%), and Nicaraguan (93.5%, a difference of 0.20%).
| Demographics | Rating | Rank | 7th Grade |
| Immigrants | Ecuador | 0.0 /100 | #318 | Tragic 93.7% |
| Immigrants | Cambodia | 0.0 /100 | #319 | Tragic 93.7% |
| Immigrants | Fiji | 0.0 /100 | #320 | Tragic 93.5% |
| Belizeans | 0.0 /100 | #321 | Tragic 93.5% |
| Nicaraguans | 0.0 /100 | #322 | Tragic 93.5% |
| Immigrants | Belize | 0.0 /100 | #323 | Tragic 93.4% |
| Dominicans | 0.0 /100 | #324 | Tragic 93.3% |
| Central American Indians | 0.0 /100 | #325 | Tragic 93.3% |
| Nepalese | 0.0 /100 | #326 | Tragic 93.2% |
| Immigrants | Cabo Verde | 0.0 /100 | #327 | Tragic 93.1% |
| Immigrants | Nicaragua | 0.0 /100 | #328 | Tragic 93.0% |
| Immigrants | Azores | 0.0 /100 | #329 | Tragic 93.0% |
| Immigrants | Dominican Republic | 0.0 /100 | #330 | Tragic 92.9% |
| Hondurans | 0.0 /100 | #331 | Tragic 92.9% |
| Hispanics or Latinos | 0.0 /100 | #332 | Tragic 92.7% |
Demographics Similar to Yuman by 7th Grade
In terms of 7th grade, the demographic groups most similar to Yuman are Immigrants from Ghana (95.2%, a difference of 0.010%), Immigrants from Hong Kong (95.2%, a difference of 0.010%), Immigrants from Uruguay (95.2%, a difference of 0.020%), Trinidadian and Tobagonian (95.2%, a difference of 0.030%), and Immigrants from Nigeria (95.2%, a difference of 0.050%).
| Demographics | Rating | Rank | 7th Grade |
| Afghans | 0.5 /100 | #260 | Tragic 95.3% |
| South Americans | 0.5 /100 | #261 | Tragic 95.2% |
| Immigrants | Somalia | 0.5 /100 | #262 | Tragic 95.2% |
| West Indians | 0.5 /100 | #263 | Tragic 95.2% |
| Immigrants | Nigeria | 0.4 /100 | #264 | Tragic 95.2% |
| Immigrants | Uruguay | 0.3 /100 | #265 | Tragic 95.2% |
| Immigrants | Ghana | 0.3 /100 | #266 | Tragic 95.2% |
| Yuman | 0.3 /100 | #267 | Tragic 95.2% |
| Immigrants | Hong Kong | 0.3 /100 | #268 | Tragic 95.2% |
| Trinidadians and Tobagonians | 0.3 /100 | #269 | Tragic 95.2% |
| Houma | 0.2 /100 | #270 | Tragic 95.1% |
| Immigrants | South America | 0.2 /100 | #271 | Tragic 95.1% |
| Peruvians | 0.2 /100 | #272 | Tragic 95.1% |
| Immigrants | Uzbekistan | 0.2 /100 | #273 | Tragic 95.1% |
| Immigrants | Western Africa | 0.2 /100 | #274 | Tragic 95.1% |