Central American Indian vs Spanish 7th Grade
COMPARE
Central American Indian
Spanish
7th Grade
7th Grade Comparison
Central American Indians
Spanish
93.3%
7TH GRADE
0.0/ 100
METRIC RATING
325th/ 347
METRIC RANK
96.3%
7TH GRADE
86.6/ 100
METRIC RATING
143rd/ 347
METRIC RANK
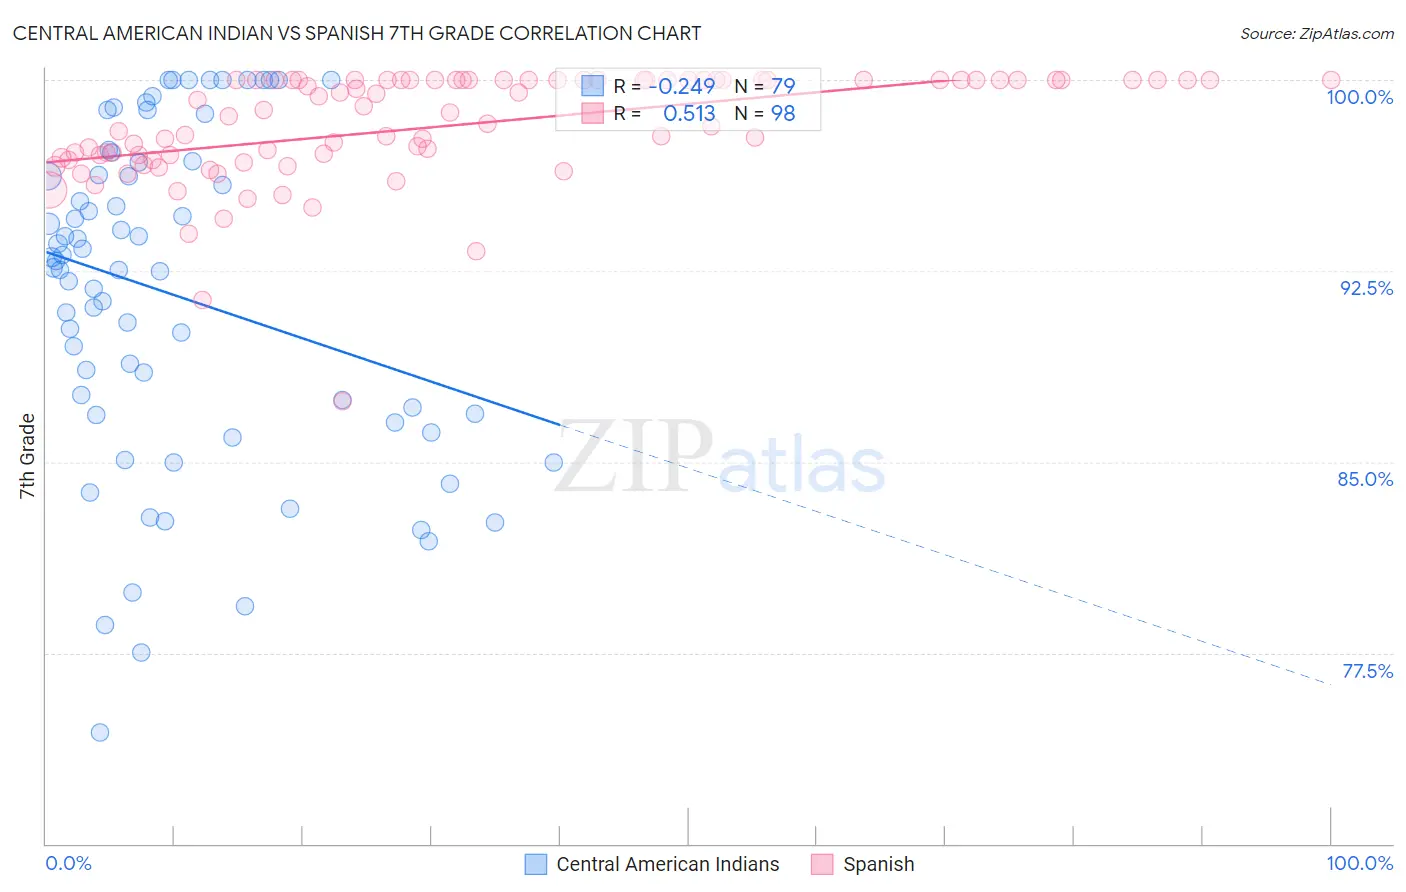
Central American Indian vs Spanish 7th Grade Correlation Chart
The statistical analysis conducted on geographies consisting of 326,142,643 people shows a weak negative correlation between the proportion of Central American Indians and percentage of population with at least 7th grade education in the United States with a correlation coefficient (R) of -0.249 and weighted average of 93.3%. Similarly, the statistical analysis conducted on geographies consisting of 422,189,188 people shows a substantial positive correlation between the proportion of Spanish and percentage of population with at least 7th grade education in the United States with a correlation coefficient (R) of 0.513 and weighted average of 96.3%, a difference of 3.3%.
7th Grade Correlation Summary
| Measurement | Central American Indian | Spanish |
| Minimum | 74.4% | 87.4% |
| Maximum | 100.0% | 100.0% |
| Range | 25.6% | 12.6% |
| Mean | 91.6% | 98.2% |
| Median | 92.6% | 98.7% |
| Interquartile 25% (IQ1) | 86.8% | 97.0% |
| Interquartile 75% (IQ3) | 96.8% | 100.0% |
| Interquartile Range (IQR) | 9.9% | 3.0% |
| Standard Deviation (Sample) | 6.4% | 2.2% |
| Standard Deviation (Population) | 6.4% | 2.2% |
Similar Demographics by 7th Grade
Demographics Similar to Central American Indians by 7th Grade
In terms of 7th grade, the demographic groups most similar to Central American Indians are Dominican (93.3%, a difference of 0.070%), Immigrants from Belize (93.4%, a difference of 0.080%), Nepalese (93.2%, a difference of 0.11%), Immigrants from Cabo Verde (93.1%, a difference of 0.18%), and Nicaraguan (93.5%, a difference of 0.20%).
| Demographics | Rating | Rank | 7th Grade |
| Immigrants | Ecuador | 0.0 /100 | #318 | Tragic 93.7% |
| Immigrants | Cambodia | 0.0 /100 | #319 | Tragic 93.7% |
| Immigrants | Fiji | 0.0 /100 | #320 | Tragic 93.5% |
| Belizeans | 0.0 /100 | #321 | Tragic 93.5% |
| Nicaraguans | 0.0 /100 | #322 | Tragic 93.5% |
| Immigrants | Belize | 0.0 /100 | #323 | Tragic 93.4% |
| Dominicans | 0.0 /100 | #324 | Tragic 93.3% |
| Central American Indians | 0.0 /100 | #325 | Tragic 93.3% |
| Nepalese | 0.0 /100 | #326 | Tragic 93.2% |
| Immigrants | Cabo Verde | 0.0 /100 | #327 | Tragic 93.1% |
| Immigrants | Nicaragua | 0.0 /100 | #328 | Tragic 93.0% |
| Immigrants | Azores | 0.0 /100 | #329 | Tragic 93.0% |
| Immigrants | Dominican Republic | 0.0 /100 | #330 | Tragic 92.9% |
| Hondurans | 0.0 /100 | #331 | Tragic 92.9% |
| Hispanics or Latinos | 0.0 /100 | #332 | Tragic 92.7% |
Demographics Similar to Spanish by 7th Grade
In terms of 7th grade, the demographic groups most similar to Spanish are Immigrants from South Central Asia (96.3%, a difference of 0.010%), Burmese (96.3%, a difference of 0.010%), Immigrants from Greece (96.3%, a difference of 0.010%), Cambodian (96.3%, a difference of 0.020%), and Blackfeet (96.3%, a difference of 0.030%).
| Demographics | Rating | Rank | 7th Grade |
| Immigrants | Hungary | 90.6 /100 | #136 | Exceptional 96.4% |
| Immigrants | Turkey | 90.2 /100 | #137 | Exceptional 96.4% |
| Jordanians | 90.0 /100 | #138 | Excellent 96.4% |
| Basques | 89.3 /100 | #139 | Excellent 96.4% |
| Cambodians | 88.3 /100 | #140 | Excellent 96.3% |
| Immigrants | South Central Asia | 87.1 /100 | #141 | Excellent 96.3% |
| Burmese | 87.1 /100 | #142 | Excellent 96.3% |
| Spanish | 86.6 /100 | #143 | Excellent 96.3% |
| Immigrants | Greece | 85.9 /100 | #144 | Excellent 96.3% |
| Blackfeet | 83.9 /100 | #145 | Excellent 96.3% |
| Immigrants | Eastern Europe | 83.7 /100 | #146 | Excellent 96.3% |
| French American Indians | 83.1 /100 | #147 | Excellent 96.3% |
| Israelis | 82.8 /100 | #148 | Excellent 96.3% |
| Albanians | 82.6 /100 | #149 | Excellent 96.3% |
| Immigrants | Belarus | 82.4 /100 | #150 | Excellent 96.3% |