Hopi vs Mongolian 6th Grade
COMPARE
Hopi
Mongolian
6th Grade
6th Grade Comparison
Hopi
Mongolians
97.2%
6TH GRADE
78.8/ 100
METRIC RATING
146th/ 347
METRIC RANK
97.0%
6TH GRADE
46.7/ 100
METRIC RATING
177th/ 347
METRIC RANK
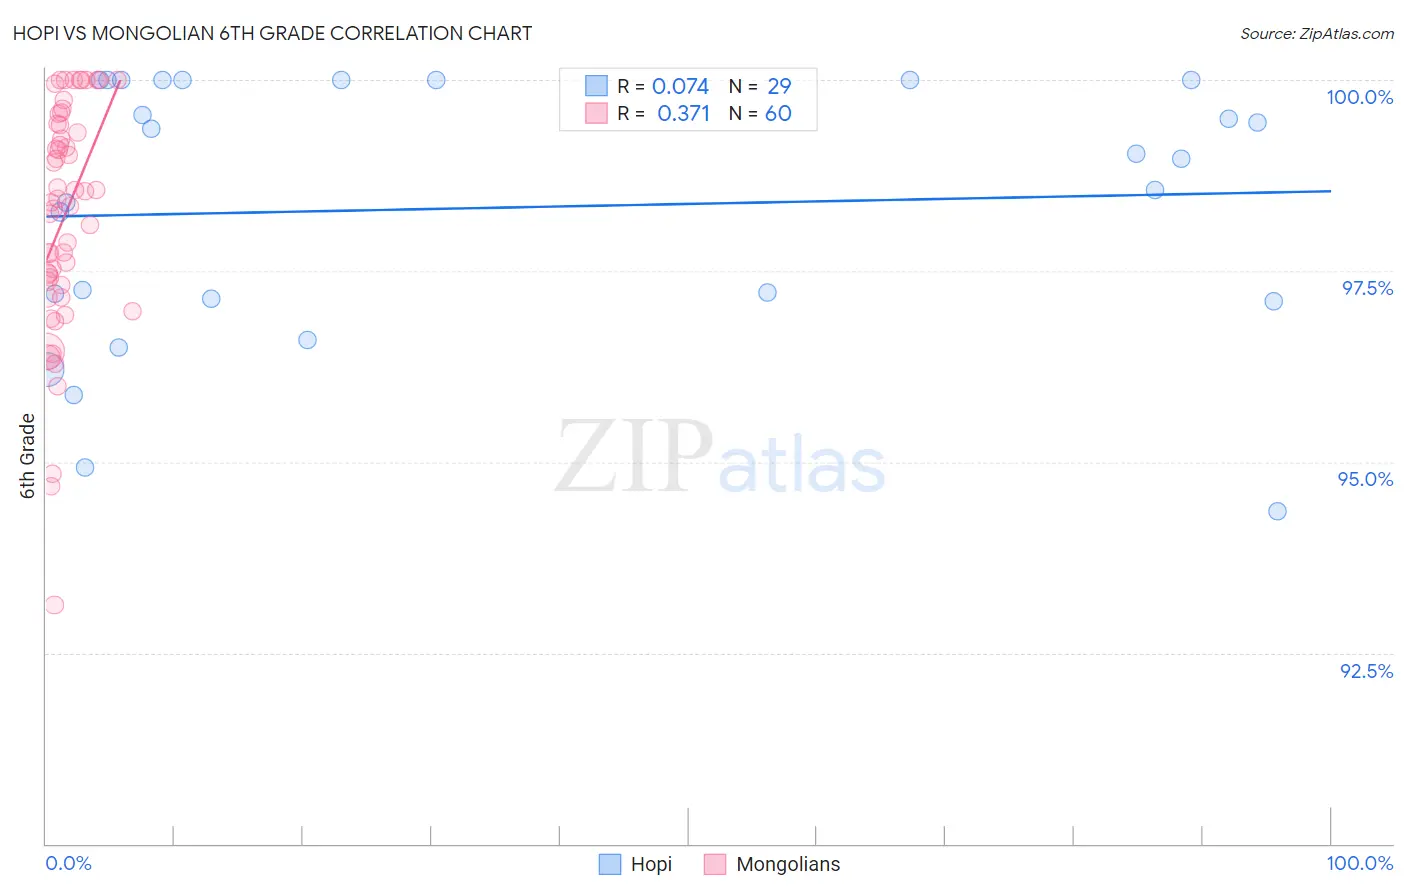
Hopi vs Mongolian 6th Grade Correlation Chart
The statistical analysis conducted on geographies consisting of 74,739,957 people shows a slight positive correlation between the proportion of Hopi and percentage of population with at least 6th grade education in the United States with a correlation coefficient (R) of 0.074 and weighted average of 97.2%. Similarly, the statistical analysis conducted on geographies consisting of 140,315,038 people shows a mild positive correlation between the proportion of Mongolians and percentage of population with at least 6th grade education in the United States with a correlation coefficient (R) of 0.371 and weighted average of 97.0%, a difference of 0.17%.
6th Grade Correlation Summary
| Measurement | Hopi | Mongolian |
| Minimum | 94.4% | 93.1% |
| Maximum | 100.0% | 100.0% |
| Range | 5.6% | 6.9% |
| Mean | 98.3% | 98.2% |
| Median | 99.0% | 98.4% |
| Interquartile 25% (IQ1) | 97.1% | 97.3% |
| Interquartile 75% (IQ3) | 100.0% | 99.4% |
| Interquartile Range (IQR) | 2.9% | 2.1% |
| Standard Deviation (Sample) | 1.7% | 1.5% |
| Standard Deviation (Population) | 1.7% | 1.5% |
Similar Demographics by 6th Grade
Demographics Similar to Hopi by 6th Grade
In terms of 6th grade, the demographic groups most similar to Hopi are Spaniard (97.2%, a difference of 0.010%), Immigrants from South Central Asia (97.2%, a difference of 0.010%), Immigrants from Greece (97.2%, a difference of 0.010%), Immigrants from Israel (97.2%, a difference of 0.020%), and Pima (97.2%, a difference of 0.030%).
| Demographics | Rating | Rank | 6th Grade |
| Immigrants | Turkey | 86.1 /100 | #139 | Excellent 97.3% |
| Immigrants | North Macedonia | 85.5 /100 | #140 | Excellent 97.2% |
| Seminole | 84.8 /100 | #141 | Excellent 97.2% |
| Jordanians | 84.6 /100 | #142 | Excellent 97.2% |
| Pima | 82.9 /100 | #143 | Excellent 97.2% |
| Israelis | 82.9 /100 | #144 | Excellent 97.2% |
| Spaniards | 80.1 /100 | #145 | Excellent 97.2% |
| Hopi | 78.8 /100 | #146 | Good 97.2% |
| Immigrants | South Central Asia | 78.1 /100 | #147 | Good 97.2% |
| Immigrants | Greece | 77.8 /100 | #148 | Good 97.2% |
| Immigrants | Israel | 76.0 /100 | #149 | Good 97.2% |
| Immigrants | Bosnia and Herzegovina | 74.8 /100 | #150 | Good 97.2% |
| French American Indians | 74.0 /100 | #151 | Good 97.2% |
| Immigrants | Jordan | 73.0 /100 | #152 | Good 97.2% |
| Immigrants | Eastern Europe | 72.6 /100 | #153 | Good 97.2% |
Demographics Similar to Mongolians by 6th Grade
In terms of 6th grade, the demographic groups most similar to Mongolians are Immigrants from Kazakhstan (97.0%, a difference of 0.0%), Immigrants from Micronesia (97.0%, a difference of 0.0%), Pakistani (97.0%, a difference of 0.0%), Venezuelan (97.0%, a difference of 0.010%), and Immigrants from Kenya (97.0%, a difference of 0.010%).
| Demographics | Rating | Rank | 6th Grade |
| Chileans | 52.1 /100 | #170 | Average 97.1% |
| Immigrants | Sri Lanka | 51.7 /100 | #171 | Average 97.1% |
| Egyptians | 50.9 /100 | #172 | Average 97.1% |
| Arabs | 50.1 /100 | #173 | Average 97.0% |
| Venezuelans | 50.0 /100 | #174 | Average 97.0% |
| Immigrants | Kazakhstan | 47.3 /100 | #175 | Average 97.0% |
| Immigrants | Micronesia | 47.1 /100 | #176 | Average 97.0% |
| Mongolians | 46.7 /100 | #177 | Average 97.0% |
| Pakistanis | 46.0 /100 | #178 | Average 97.0% |
| Immigrants | Kenya | 45.3 /100 | #179 | Average 97.0% |
| Immigrants | Spain | 39.9 /100 | #180 | Fair 97.0% |
| Comanche | 37.9 /100 | #181 | Fair 97.0% |
| Immigrants | Ukraine | 35.6 /100 | #182 | Fair 97.0% |
| Immigrants | Venezuela | 34.5 /100 | #183 | Fair 97.0% |
| Spanish Americans | 33.5 /100 | #184 | Fair 97.0% |