Spanish American Indian vs Mongolian 6th Grade
COMPARE
Spanish American Indian
Mongolian
6th Grade
6th Grade Comparison
Spanish American Indians
Mongolians
93.6%
6TH GRADE
0.0/ 100
METRIC RATING
346th/ 347
METRIC RANK
97.0%
6TH GRADE
46.7/ 100
METRIC RATING
177th/ 347
METRIC RANK
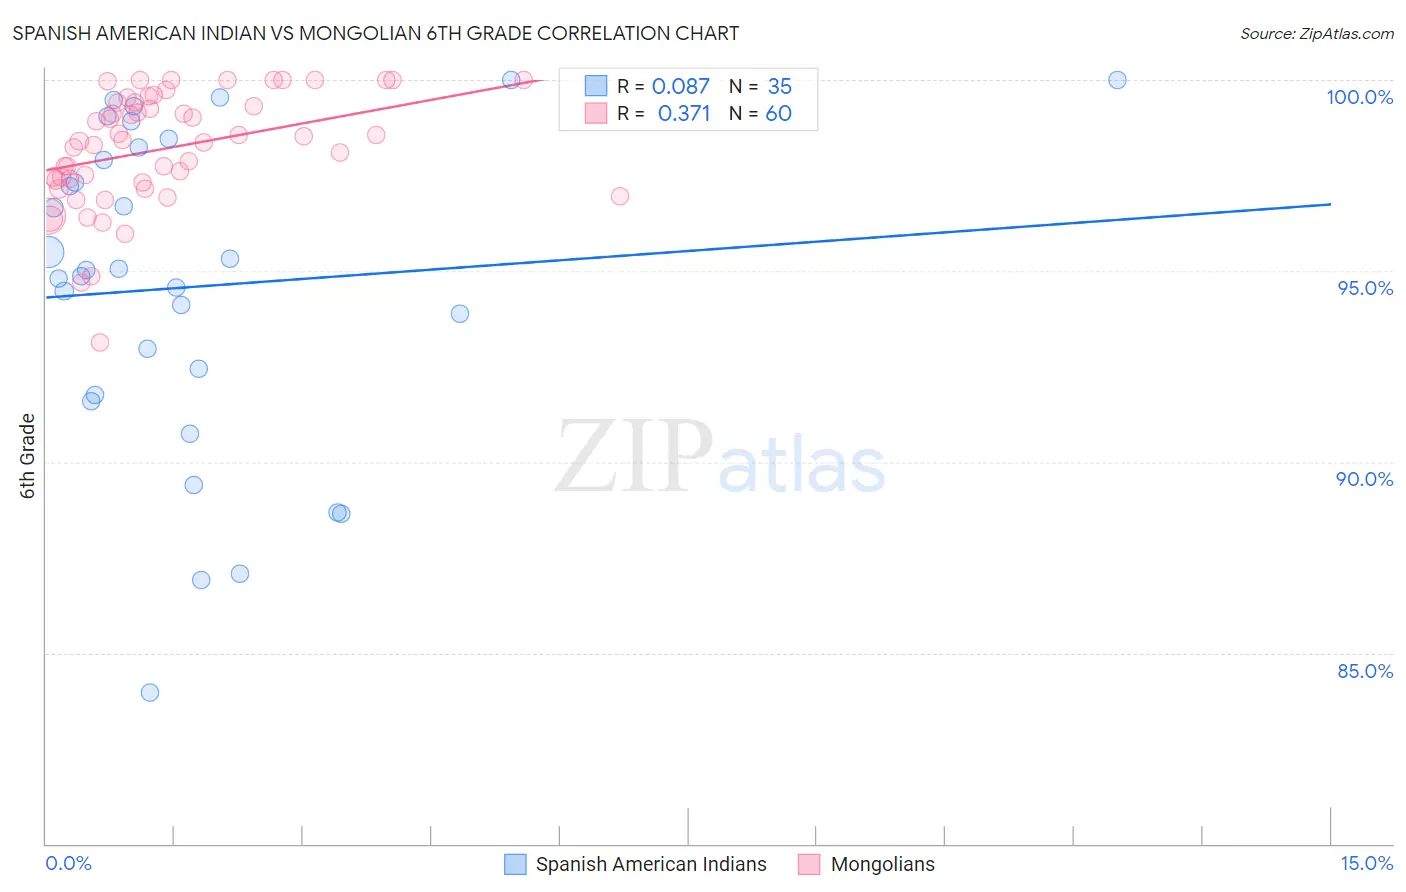
Spanish American Indian vs Mongolian 6th Grade Correlation Chart
The statistical analysis conducted on geographies consisting of 73,150,359 people shows a slight positive correlation between the proportion of Spanish American Indians and percentage of population with at least 6th grade education in the United States with a correlation coefficient (R) of 0.087 and weighted average of 93.6%. Similarly, the statistical analysis conducted on geographies consisting of 140,315,038 people shows a mild positive correlation between the proportion of Mongolians and percentage of population with at least 6th grade education in the United States with a correlation coefficient (R) of 0.371 and weighted average of 97.0%, a difference of 3.6%.
6th Grade Correlation Summary
| Measurement | Spanish American Indian | Mongolian |
| Minimum | 84.0% | 93.1% |
| Maximum | 100.0% | 100.0% |
| Range | 16.0% | 6.9% |
| Mean | 94.6% | 98.2% |
| Median | 95.0% | 98.4% |
| Interquartile 25% (IQ1) | 91.7% | 97.3% |
| Interquartile 75% (IQ3) | 98.2% | 99.4% |
| Interquartile Range (IQR) | 6.5% | 2.1% |
| Standard Deviation (Sample) | 4.2% | 1.5% |
| Standard Deviation (Population) | 4.1% | 1.5% |
Similar Demographics by 6th Grade
Demographics Similar to Spanish American Indians by 6th Grade
In terms of 6th grade, the demographic groups most similar to Spanish American Indians are Immigrants from El Salvador (93.6%, a difference of 0.040%), Immigrants from Guatemala (93.9%, a difference of 0.34%), Salvadoran (93.9%, a difference of 0.34%), Immigrants from Mexico (93.9%, a difference of 0.35%), and Immigrants from Central America (94.0%, a difference of 0.41%).
| Demographics | Rating | Rank | 6th Grade |
| Immigrants | Latin America | 0.0 /100 | #333 | Tragic 94.7% |
| Immigrants | Azores | 0.0 /100 | #334 | Tragic 94.7% |
| Mexicans | 0.0 /100 | #335 | Tragic 94.6% |
| Immigrants | Dominican Republic | 0.0 /100 | #336 | Tragic 94.6% |
| Central Americans | 0.0 /100 | #337 | Tragic 94.5% |
| Immigrants | Cabo Verde | 0.0 /100 | #338 | Tragic 94.4% |
| Yakama | 0.0 /100 | #339 | Tragic 94.3% |
| Guatemalans | 0.0 /100 | #340 | Tragic 94.2% |
| Immigrants | Yemen | 0.0 /100 | #341 | Tragic 94.1% |
| Immigrants | Central America | 0.0 /100 | #342 | Tragic 94.0% |
| Immigrants | Mexico | 0.0 /100 | #343 | Tragic 93.9% |
| Immigrants | Guatemala | 0.0 /100 | #344 | Tragic 93.9% |
| Salvadorans | 0.0 /100 | #345 | Tragic 93.9% |
| Spanish American Indians | 0.0 /100 | #346 | Tragic 93.6% |
| Immigrants | El Salvador | 0.0 /100 | #347 | Tragic 93.6% |
Demographics Similar to Mongolians by 6th Grade
In terms of 6th grade, the demographic groups most similar to Mongolians are Immigrants from Kazakhstan (97.0%, a difference of 0.0%), Immigrants from Micronesia (97.0%, a difference of 0.0%), Pakistani (97.0%, a difference of 0.0%), Venezuelan (97.0%, a difference of 0.010%), and Immigrants from Kenya (97.0%, a difference of 0.010%).
| Demographics | Rating | Rank | 6th Grade |
| Chileans | 52.1 /100 | #170 | Average 97.1% |
| Immigrants | Sri Lanka | 51.7 /100 | #171 | Average 97.1% |
| Egyptians | 50.9 /100 | #172 | Average 97.1% |
| Arabs | 50.1 /100 | #173 | Average 97.0% |
| Venezuelans | 50.0 /100 | #174 | Average 97.0% |
| Immigrants | Kazakhstan | 47.3 /100 | #175 | Average 97.0% |
| Immigrants | Micronesia | 47.1 /100 | #176 | Average 97.0% |
| Mongolians | 46.7 /100 | #177 | Average 97.0% |
| Pakistanis | 46.0 /100 | #178 | Average 97.0% |
| Immigrants | Kenya | 45.3 /100 | #179 | Average 97.0% |
| Immigrants | Spain | 39.9 /100 | #180 | Fair 97.0% |
| Comanche | 37.9 /100 | #181 | Fair 97.0% |
| Immigrants | Ukraine | 35.6 /100 | #182 | Fair 97.0% |
| Immigrants | Venezuela | 34.5 /100 | #183 | Fair 97.0% |
| Spanish Americans | 33.5 /100 | #184 | Fair 97.0% |