Immigrants from Southern Europe vs Mongolian 6th Grade
COMPARE
Immigrants from Southern Europe
Mongolian
6th Grade
6th Grade Comparison
Immigrants from Southern Europe
Mongolians
96.7%
6TH GRADE
4.4/ 100
METRIC RATING
224th/ 347
METRIC RANK
97.0%
6TH GRADE
46.7/ 100
METRIC RATING
177th/ 347
METRIC RANK
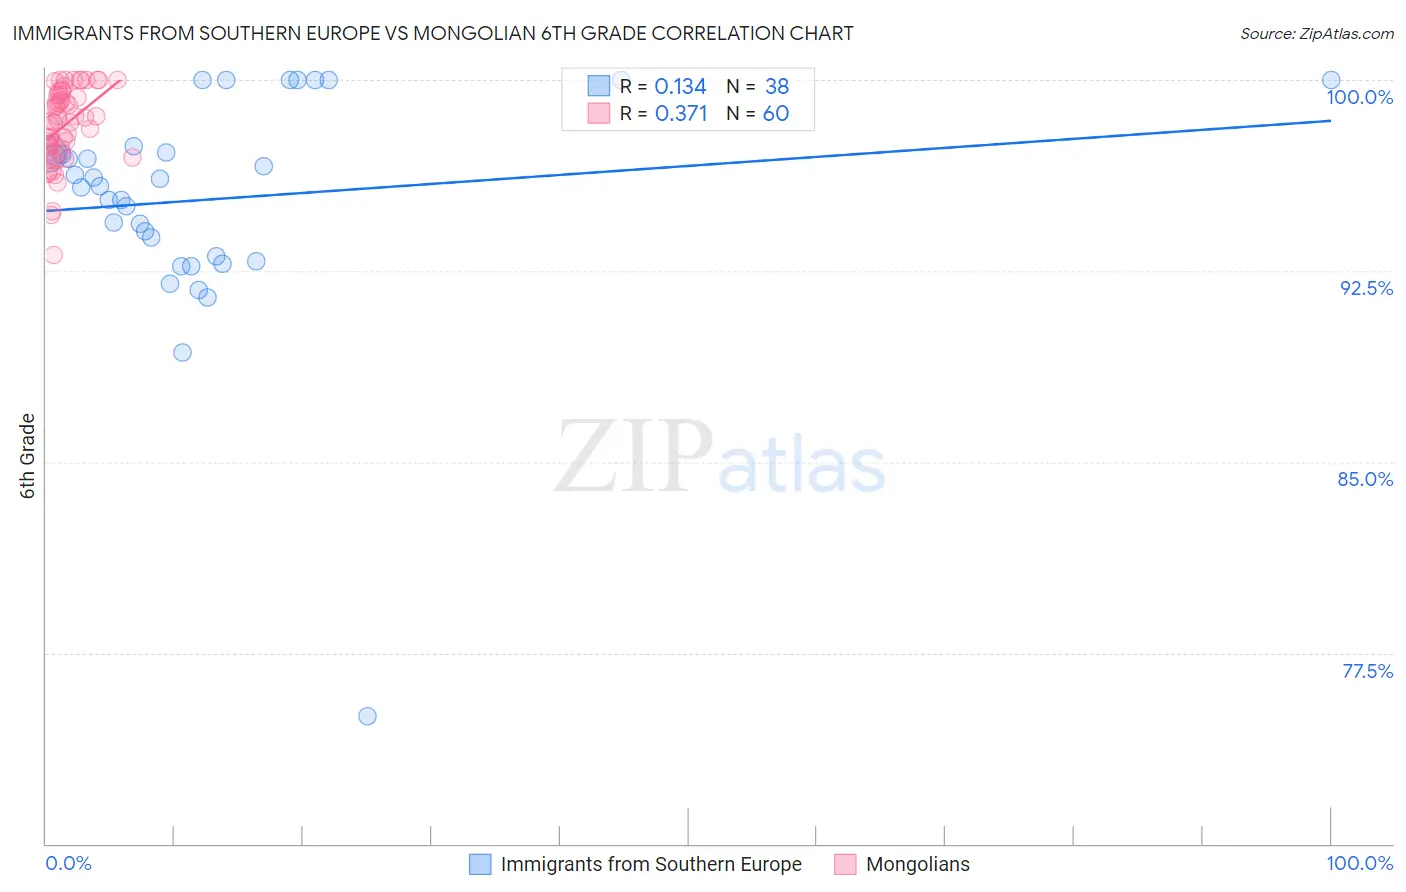
Immigrants from Southern Europe vs Mongolian 6th Grade Correlation Chart
The statistical analysis conducted on geographies consisting of 402,804,595 people shows a poor positive correlation between the proportion of Immigrants from Southern Europe and percentage of population with at least 6th grade education in the United States with a correlation coefficient (R) of 0.134 and weighted average of 96.7%. Similarly, the statistical analysis conducted on geographies consisting of 140,315,038 people shows a mild positive correlation between the proportion of Mongolians and percentage of population with at least 6th grade education in the United States with a correlation coefficient (R) of 0.371 and weighted average of 97.0%, a difference of 0.34%.
6th Grade Correlation Summary
| Measurement | Immigrants from Southern Europe | Mongolian |
| Minimum | 75.0% | 93.1% |
| Maximum | 100.0% | 100.0% |
| Range | 25.0% | 6.9% |
| Mean | 95.3% | 98.2% |
| Median | 96.0% | 98.4% |
| Interquartile 25% (IQ1) | 93.1% | 97.3% |
| Interquartile 75% (IQ3) | 97.2% | 99.4% |
| Interquartile Range (IQR) | 4.1% | 2.1% |
| Standard Deviation (Sample) | 4.4% | 1.5% |
| Standard Deviation (Population) | 4.4% | 1.5% |
Similar Demographics by 6th Grade
Demographics Similar to Immigrants from Southern Europe by 6th Grade
In terms of 6th grade, the demographic groups most similar to Immigrants from Southern Europe are Immigrants from Pakistan (96.7%, a difference of 0.0%), Bahamian (96.7%, a difference of 0.010%), Immigrants from Panama (96.7%, a difference of 0.010%), Immigrants from Western Asia (96.7%, a difference of 0.010%), and Immigrants from Malaysia (96.7%, a difference of 0.010%).
| Demographics | Rating | Rank | 6th Grade |
| Liberians | 7.5 /100 | #217 | Tragic 96.8% |
| Navajo | 7.3 /100 | #218 | Tragic 96.8% |
| Costa Ricans | 6.8 /100 | #219 | Tragic 96.8% |
| Immigrants | Morocco | 6.2 /100 | #220 | Tragic 96.7% |
| Tongans | 6.1 /100 | #221 | Tragic 96.7% |
| Immigrants | Syria | 5.9 /100 | #222 | Tragic 96.7% |
| Bahamians | 4.8 /100 | #223 | Tragic 96.7% |
| Immigrants | Southern Europe | 4.4 /100 | #224 | Tragic 96.7% |
| Immigrants | Pakistan | 4.4 /100 | #225 | Tragic 96.7% |
| Immigrants | Panama | 4.2 /100 | #226 | Tragic 96.7% |
| Immigrants | Western Asia | 4.1 /100 | #227 | Tragic 96.7% |
| Immigrants | Malaysia | 4.0 /100 | #228 | Tragic 96.7% |
| Assyrians/Chaldeans/Syriacs | 4.0 /100 | #229 | Tragic 96.7% |
| Immigrants | Eastern Asia | 4.0 /100 | #230 | Tragic 96.7% |
| Sub-Saharan Africans | 3.5 /100 | #231 | Tragic 96.7% |
Demographics Similar to Mongolians by 6th Grade
In terms of 6th grade, the demographic groups most similar to Mongolians are Immigrants from Kazakhstan (97.0%, a difference of 0.0%), Immigrants from Micronesia (97.0%, a difference of 0.0%), Pakistani (97.0%, a difference of 0.0%), Venezuelan (97.0%, a difference of 0.010%), and Immigrants from Kenya (97.0%, a difference of 0.010%).
| Demographics | Rating | Rank | 6th Grade |
| Chileans | 52.1 /100 | #170 | Average 97.1% |
| Immigrants | Sri Lanka | 51.7 /100 | #171 | Average 97.1% |
| Egyptians | 50.9 /100 | #172 | Average 97.1% |
| Arabs | 50.1 /100 | #173 | Average 97.0% |
| Venezuelans | 50.0 /100 | #174 | Average 97.0% |
| Immigrants | Kazakhstan | 47.3 /100 | #175 | Average 97.0% |
| Immigrants | Micronesia | 47.1 /100 | #176 | Average 97.0% |
| Mongolians | 46.7 /100 | #177 | Average 97.0% |
| Pakistanis | 46.0 /100 | #178 | Average 97.0% |
| Immigrants | Kenya | 45.3 /100 | #179 | Average 97.0% |
| Immigrants | Spain | 39.9 /100 | #180 | Fair 97.0% |
| Comanche | 37.9 /100 | #181 | Fair 97.0% |
| Immigrants | Ukraine | 35.6 /100 | #182 | Fair 97.0% |
| Immigrants | Venezuela | 34.5 /100 | #183 | Fair 97.0% |
| Spanish Americans | 33.5 /100 | #184 | Fair 97.0% |