Comanche vs Immigrants from Western Africa Bachelor's Degree
COMPARE
Comanche
Immigrants from Western Africa
Bachelor's Degree
Bachelor's Degree Comparison
Comanche
Immigrants from Western Africa
31.9%
BACHELOR'S DEGREE
0.2/ 100
METRIC RATING
272nd/ 347
METRIC RANK
36.1%
BACHELOR'S DEGREE
13.8/ 100
METRIC RATING
215th/ 347
METRIC RANK
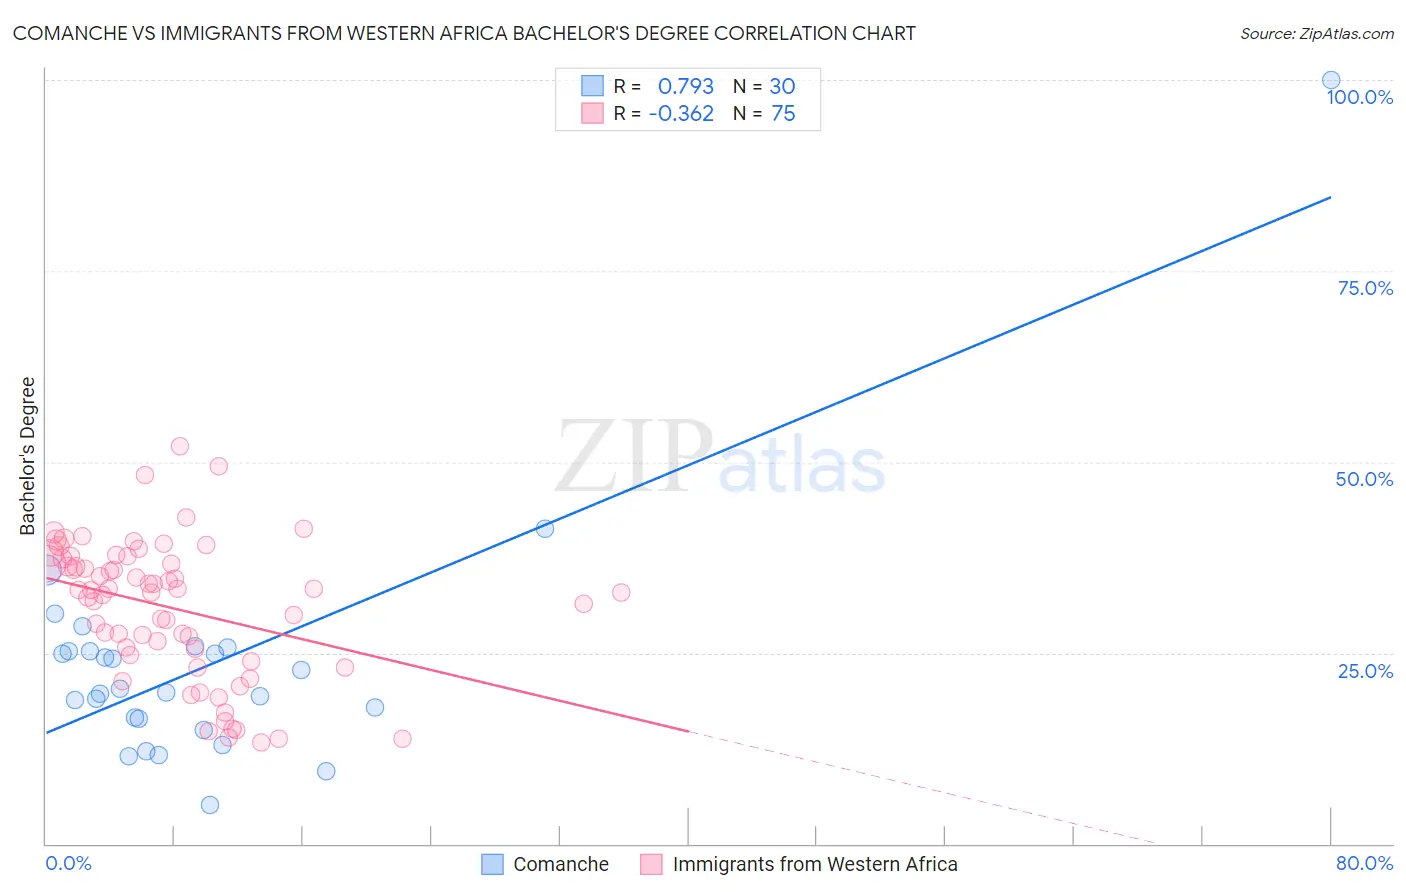
Comanche vs Immigrants from Western Africa Bachelor's Degree Correlation Chart
The statistical analysis conducted on geographies consisting of 109,781,211 people shows a strong positive correlation between the proportion of Comanche and percentage of population with at least bachelor's degree education in the United States with a correlation coefficient (R) of 0.793 and weighted average of 31.9%. Similarly, the statistical analysis conducted on geographies consisting of 357,836,949 people shows a mild negative correlation between the proportion of Immigrants from Western Africa and percentage of population with at least bachelor's degree education in the United States with a correlation coefficient (R) of -0.362 and weighted average of 36.1%, a difference of 13.3%.
Bachelor's Degree Correlation Summary
| Measurement | Comanche | Immigrants from Western Africa |
| Minimum | 5.1% | 13.3% |
| Maximum | 100.0% | 52.0% |
| Range | 94.9% | 38.8% |
| Mean | 23.5% | 30.9% |
| Median | 20.1% | 33.2% |
| Interquartile 25% (IQ1) | 16.4% | 24.6% |
| Interquartile 75% (IQ3) | 25.1% | 37.3% |
| Interquartile Range (IQR) | 8.7% | 12.6% |
| Standard Deviation (Sample) | 16.4% | 9.0% |
| Standard Deviation (Population) | 16.1% | 8.9% |
Similar Demographics by Bachelor's Degree
Demographics Similar to Comanche by Bachelor's Degree
In terms of bachelor's degree, the demographic groups most similar to Comanche are Central American (31.9%, a difference of 0.030%), Immigrants from Nicaragua (31.9%, a difference of 0.12%), American (31.9%, a difference of 0.12%), Potawatomi (31.9%, a difference of 0.14%), and Samoan (31.8%, a difference of 0.27%).
| Demographics | Rating | Rank | Bachelor's Degree |
| Bahamians | 0.3 /100 | #265 | Tragic 32.5% |
| Immigrants | Dominica | 0.3 /100 | #266 | Tragic 32.5% |
| Cubans | 0.3 /100 | #267 | Tragic 32.5% |
| Immigrants | Portugal | 0.2 /100 | #268 | Tragic 32.2% |
| Immigrants | Belize | 0.2 /100 | #269 | Tragic 32.1% |
| Immigrants | Nicaragua | 0.2 /100 | #270 | Tragic 31.9% |
| Central Americans | 0.2 /100 | #271 | Tragic 31.9% |
| Comanche | 0.2 /100 | #272 | Tragic 31.9% |
| Americans | 0.2 /100 | #273 | Tragic 31.9% |
| Potawatomi | 0.2 /100 | #274 | Tragic 31.9% |
| Samoans | 0.1 /100 | #275 | Tragic 31.8% |
| Salvadorans | 0.1 /100 | #276 | Tragic 31.8% |
| Dominicans | 0.1 /100 | #277 | Tragic 31.8% |
| Marshallese | 0.1 /100 | #278 | Tragic 31.7% |
| Hawaiians | 0.1 /100 | #279 | Tragic 31.6% |
Demographics Similar to Immigrants from Western Africa by Bachelor's Degree
In terms of bachelor's degree, the demographic groups most similar to Immigrants from Western Africa are German (36.1%, a difference of 0.030%), Barbadian (36.1%, a difference of 0.060%), Immigrants from Panama (36.2%, a difference of 0.10%), Immigrants from Philippines (36.4%, a difference of 0.78%), and Scotch-Irish (36.4%, a difference of 0.86%).
| Demographics | Rating | Rank | Bachelor's Degree |
| Immigrants | Thailand | 19.4 /100 | #208 | Poor 36.5% |
| Panamanians | 18.8 /100 | #209 | Poor 36.5% |
| French | 18.6 /100 | #210 | Poor 36.5% |
| Scotch-Irish | 18.3 /100 | #211 | Poor 36.4% |
| Immigrants | Philippines | 17.8 /100 | #212 | Poor 36.4% |
| Immigrants | Panama | 14.2 /100 | #213 | Poor 36.2% |
| Germans | 13.9 /100 | #214 | Poor 36.1% |
| Immigrants | Western Africa | 13.8 /100 | #215 | Poor 36.1% |
| Barbadians | 13.5 /100 | #216 | Poor 36.1% |
| German Russians | 10.2 /100 | #217 | Poor 35.8% |
| Sub-Saharan Africans | 9.8 /100 | #218 | Tragic 35.8% |
| West Indians | 9.7 /100 | #219 | Tragic 35.8% |
| Spanish | 9.6 /100 | #220 | Tragic 35.8% |
| Dutch | 9.2 /100 | #221 | Tragic 35.7% |
| Trinidadians and Tobagonians | 8.8 /100 | #222 | Tragic 35.7% |