Celtic vs Pima Doctorate Degree
COMPARE
Celtic
Pima
Doctorate Degree
Doctorate Degree Comparison
Celtics
Pima
1.9%
DOCTORATE DEGREE
66.7/ 100
METRIC RATING
164th/ 347
METRIC RANK
1.3%
DOCTORATE DEGREE
0.0/ 100
METRIC RATING
325th/ 347
METRIC RANK
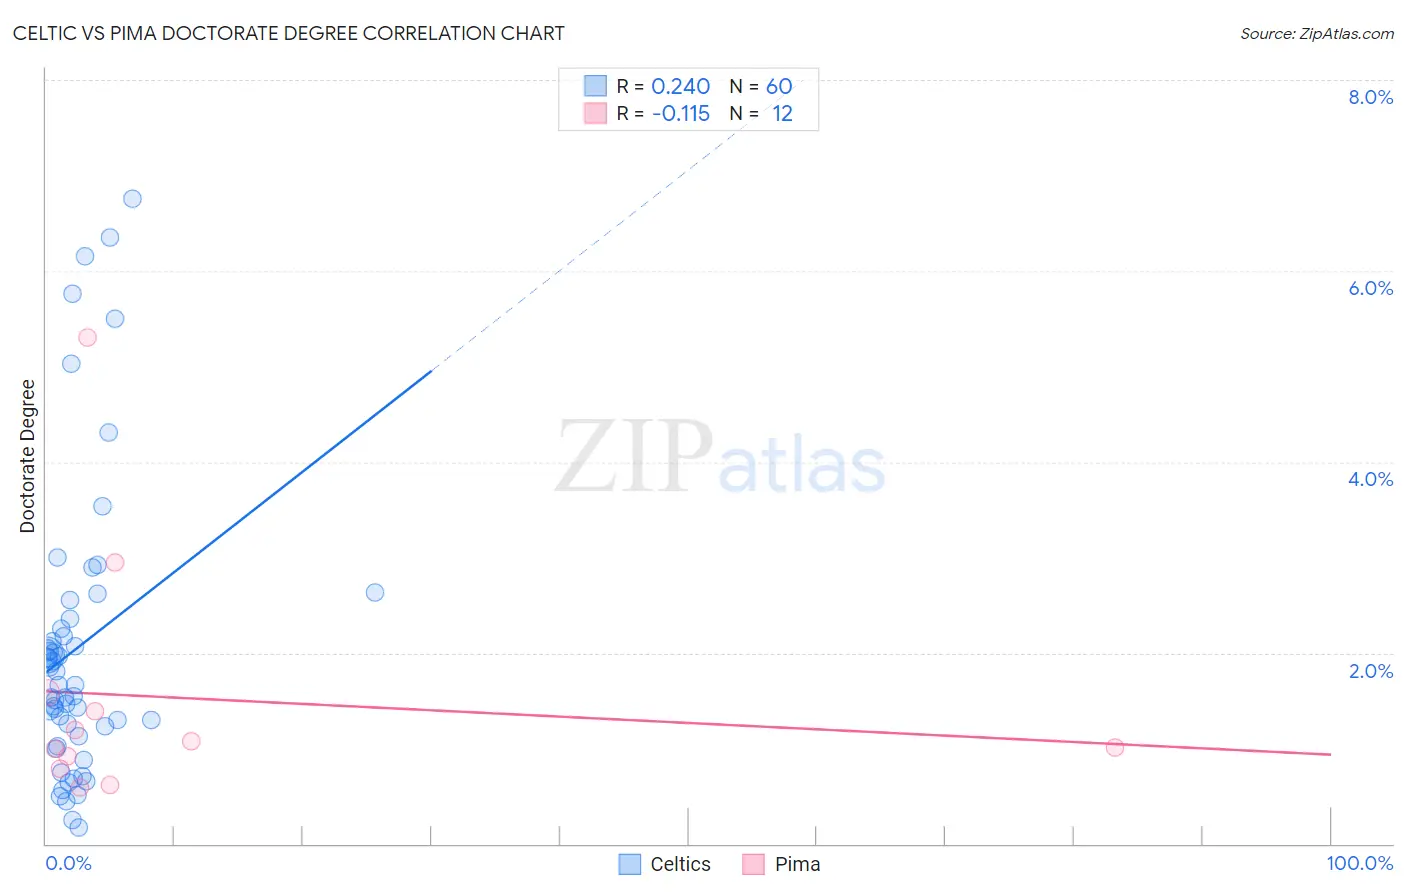
Celtic vs Pima Doctorate Degree Correlation Chart
The statistical analysis conducted on geographies consisting of 167,913,023 people shows a weak positive correlation between the proportion of Celtics and percentage of population with at least doctorate degree education in the United States with a correlation coefficient (R) of 0.240 and weighted average of 1.9%. Similarly, the statistical analysis conducted on geographies consisting of 61,222,520 people shows a poor negative correlation between the proportion of Pima and percentage of population with at least doctorate degree education in the United States with a correlation coefficient (R) of -0.115 and weighted average of 1.3%, a difference of 43.0%.
Doctorate Degree Correlation Summary
| Measurement | Celtic | Pima |
| Minimum | 0.17% | 0.59% |
| Maximum | 6.8% | 5.3% |
| Range | 6.6% | 4.7% |
| Mean | 2.1% | 1.5% |
| Median | 1.7% | 1.0% |
| Interquartile 25% (IQ1) | 1.2% | 0.85% |
| Interquartile 75% (IQ3) | 2.3% | 1.5% |
| Interquartile Range (IQR) | 1.1% | 0.64% |
| Standard Deviation (Sample) | 1.5% | 1.3% |
| Standard Deviation (Population) | 1.5% | 1.3% |
Similar Demographics by Doctorate Degree
Demographics Similar to Celtics by Doctorate Degree
In terms of doctorate degree, the demographic groups most similar to Celtics are Czech (1.9%, a difference of 0.10%), Irish (1.9%, a difference of 0.13%), Immigrants from Middle Africa (1.9%, a difference of 0.35%), Scotch-Irish (1.9%, a difference of 0.49%), and Welsh (1.9%, a difference of 0.50%).
| Demographics | Rating | Rank | Doctorate Degree |
| Danes | 71.9 /100 | #157 | Good 1.9% |
| Hungarians | 71.7 /100 | #158 | Good 1.9% |
| Slovenes | 70.2 /100 | #159 | Good 1.9% |
| Welsh | 69.7 /100 | #160 | Good 1.9% |
| Immigrants | Middle Africa | 68.8 /100 | #161 | Good 1.9% |
| Irish | 67.5 /100 | #162 | Good 1.9% |
| Czechs | 67.3 /100 | #163 | Good 1.9% |
| Celtics | 66.7 /100 | #164 | Good 1.9% |
| Scotch-Irish | 63.6 /100 | #165 | Good 1.9% |
| Spaniards | 63.5 /100 | #166 | Good 1.9% |
| Macedonians | 60.9 /100 | #167 | Good 1.9% |
| Sri Lankans | 60.3 /100 | #168 | Good 1.9% |
| Vietnamese | 54.8 /100 | #169 | Average 1.9% |
| Costa Ricans | 53.3 /100 | #170 | Average 1.8% |
| Bermudans | 52.1 /100 | #171 | Average 1.8% |
Demographics Similar to Pima by Doctorate Degree
In terms of doctorate degree, the demographic groups most similar to Pima are Immigrants from Cabo Verde (1.3%, a difference of 0.020%), Hispanic or Latino (1.3%, a difference of 0.31%), Native/Alaskan (1.3%, a difference of 0.39%), Immigrants from Belize (1.3%, a difference of 0.72%), and Inupiat (1.3%, a difference of 0.89%).
| Demographics | Rating | Rank | Doctorate Degree |
| Creek | 0.1 /100 | #318 | Tragic 1.3% |
| Immigrants | Guyana | 0.1 /100 | #319 | Tragic 1.3% |
| Immigrants | St. Vincent and the Grenadines | 0.1 /100 | #320 | Tragic 1.3% |
| Dutch West Indians | 0.1 /100 | #321 | Tragic 1.3% |
| Seminole | 0.1 /100 | #322 | Tragic 1.3% |
| Immigrants | Belize | 0.1 /100 | #323 | Tragic 1.3% |
| Natives/Alaskans | 0.0 /100 | #324 | Tragic 1.3% |
| Pima | 0.0 /100 | #325 | Tragic 1.3% |
| Immigrants | Cabo Verde | 0.0 /100 | #326 | Tragic 1.3% |
| Hispanics or Latinos | 0.0 /100 | #327 | Tragic 1.3% |
| Inupiat | 0.0 /100 | #328 | Tragic 1.3% |
| Haitians | 0.0 /100 | #329 | Tragic 1.3% |
| Yup'ik | 0.0 /100 | #330 | Tragic 1.3% |
| Immigrants | Latin America | 0.0 /100 | #331 | Tragic 1.3% |
| Yakama | 0.0 /100 | #332 | Tragic 1.3% |