Ugandan vs Immigrants from Morocco 6th Grade
COMPARE
Ugandan
Immigrants from Morocco
6th Grade
6th Grade Comparison
Ugandans
Immigrants from Morocco
97.1%
6TH GRADE
62.2/ 100
METRIC RATING
160th/ 347
METRIC RANK
96.7%
6TH GRADE
6.2/ 100
METRIC RATING
220th/ 347
METRIC RANK
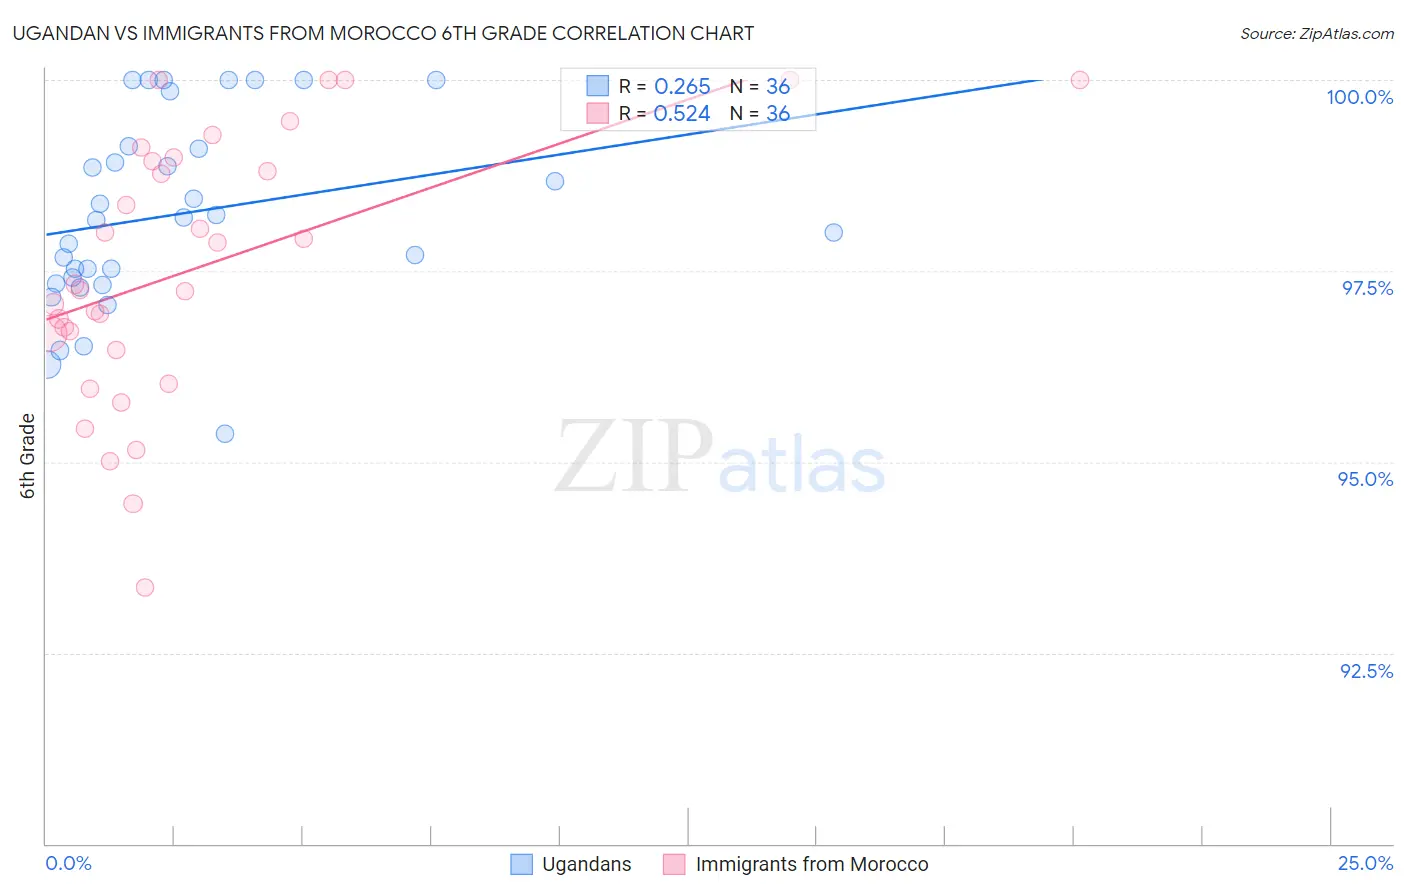
Ugandan vs Immigrants from Morocco 6th Grade Correlation Chart
The statistical analysis conducted on geographies consisting of 93,991,892 people shows a weak positive correlation between the proportion of Ugandans and percentage of population with at least 6th grade education in the United States with a correlation coefficient (R) of 0.265 and weighted average of 97.1%. Similarly, the statistical analysis conducted on geographies consisting of 178,910,634 people shows a substantial positive correlation between the proportion of Immigrants from Morocco and percentage of population with at least 6th grade education in the United States with a correlation coefficient (R) of 0.524 and weighted average of 96.7%, a difference of 0.37%.
6th Grade Correlation Summary
| Measurement | Ugandan | Immigrants from Morocco |
| Minimum | 95.4% | 93.4% |
| Maximum | 100.0% | 100.0% |
| Range | 4.6% | 6.6% |
| Mean | 98.2% | 97.5% |
| Median | 98.2% | 97.3% |
| Interquartile 25% (IQ1) | 97.4% | 96.6% |
| Interquartile 75% (IQ3) | 99.1% | 99.0% |
| Interquartile Range (IQR) | 1.7% | 2.4% |
| Standard Deviation (Sample) | 1.2% | 1.7% |
| Standard Deviation (Population) | 1.2% | 1.7% |
Similar Demographics by 6th Grade
Demographics Similar to Ugandans by 6th Grade
In terms of 6th grade, the demographic groups most similar to Ugandans are Kenyan (97.1%, a difference of 0.0%), Immigrants from Iran (97.1%, a difference of 0.010%), Immigrants from Belarus (97.1%, a difference of 0.010%), Marshallese (97.1%, a difference of 0.010%), and Albanian (97.1%, a difference of 0.020%).
| Demographics | Rating | Rank | 6th Grade |
| Immigrants | Eastern Europe | 72.6 /100 | #153 | Good 97.2% |
| Soviet Union | 71.5 /100 | #154 | Good 97.2% |
| Ute | 71.1 /100 | #155 | Good 97.1% |
| Alsatians | 69.8 /100 | #156 | Good 97.1% |
| Immigrants | Russia | 67.6 /100 | #157 | Good 97.1% |
| Immigrants | Iran | 63.3 /100 | #158 | Good 97.1% |
| Kenyans | 62.9 /100 | #159 | Good 97.1% |
| Ugandans | 62.2 /100 | #160 | Good 97.1% |
| Immigrants | Belarus | 60.4 /100 | #161 | Good 97.1% |
| Marshallese | 60.2 /100 | #162 | Good 97.1% |
| Albanians | 57.8 /100 | #163 | Average 97.1% |
| Immigrants | Korea | 57.7 /100 | #164 | Average 97.1% |
| Immigrants | Poland | 56.2 /100 | #165 | Average 97.1% |
| Immigrants | Italy | 53.8 /100 | #166 | Average 97.1% |
| Apache | 53.6 /100 | #167 | Average 97.1% |
Demographics Similar to Immigrants from Morocco by 6th Grade
In terms of 6th grade, the demographic groups most similar to Immigrants from Morocco are Tongan (96.7%, a difference of 0.0%), Costa Rican (96.8%, a difference of 0.010%), Immigrants from Syria (96.7%, a difference of 0.010%), Liberian (96.8%, a difference of 0.020%), and Navajo (96.8%, a difference of 0.020%).
| Demographics | Rating | Rank | 6th Grade |
| Immigrants | Sudan | 8.7 /100 | #213 | Tragic 96.8% |
| Portuguese | 8.2 /100 | #214 | Tragic 96.8% |
| Sierra Leoneans | 8.0 /100 | #215 | Tragic 96.8% |
| Paiute | 7.8 /100 | #216 | Tragic 96.8% |
| Liberians | 7.5 /100 | #217 | Tragic 96.8% |
| Navajo | 7.3 /100 | #218 | Tragic 96.8% |
| Costa Ricans | 6.8 /100 | #219 | Tragic 96.8% |
| Immigrants | Morocco | 6.2 /100 | #220 | Tragic 96.7% |
| Tongans | 6.1 /100 | #221 | Tragic 96.7% |
| Immigrants | Syria | 5.9 /100 | #222 | Tragic 96.7% |
| Bahamians | 4.8 /100 | #223 | Tragic 96.7% |
| Immigrants | Southern Europe | 4.4 /100 | #224 | Tragic 96.7% |
| Immigrants | Pakistan | 4.4 /100 | #225 | Tragic 96.7% |
| Immigrants | Panama | 4.2 /100 | #226 | Tragic 96.7% |
| Immigrants | Western Asia | 4.1 /100 | #227 | Tragic 96.7% |