Celtic vs Assyrian/Chaldean/Syriac Master's Degree
COMPARE
Celtic
Assyrian/Chaldean/Syriac
Master's Degree
Master's Degree Comparison
Celtics
Assyrians/Chaldeans/Syriacs
14.8%
MASTER'S DEGREE
41.3/ 100
METRIC RATING
180th/ 347
METRIC RANK
15.8%
MASTER'S DEGREE
86.8/ 100
METRIC RATING
136th/ 347
METRIC RANK
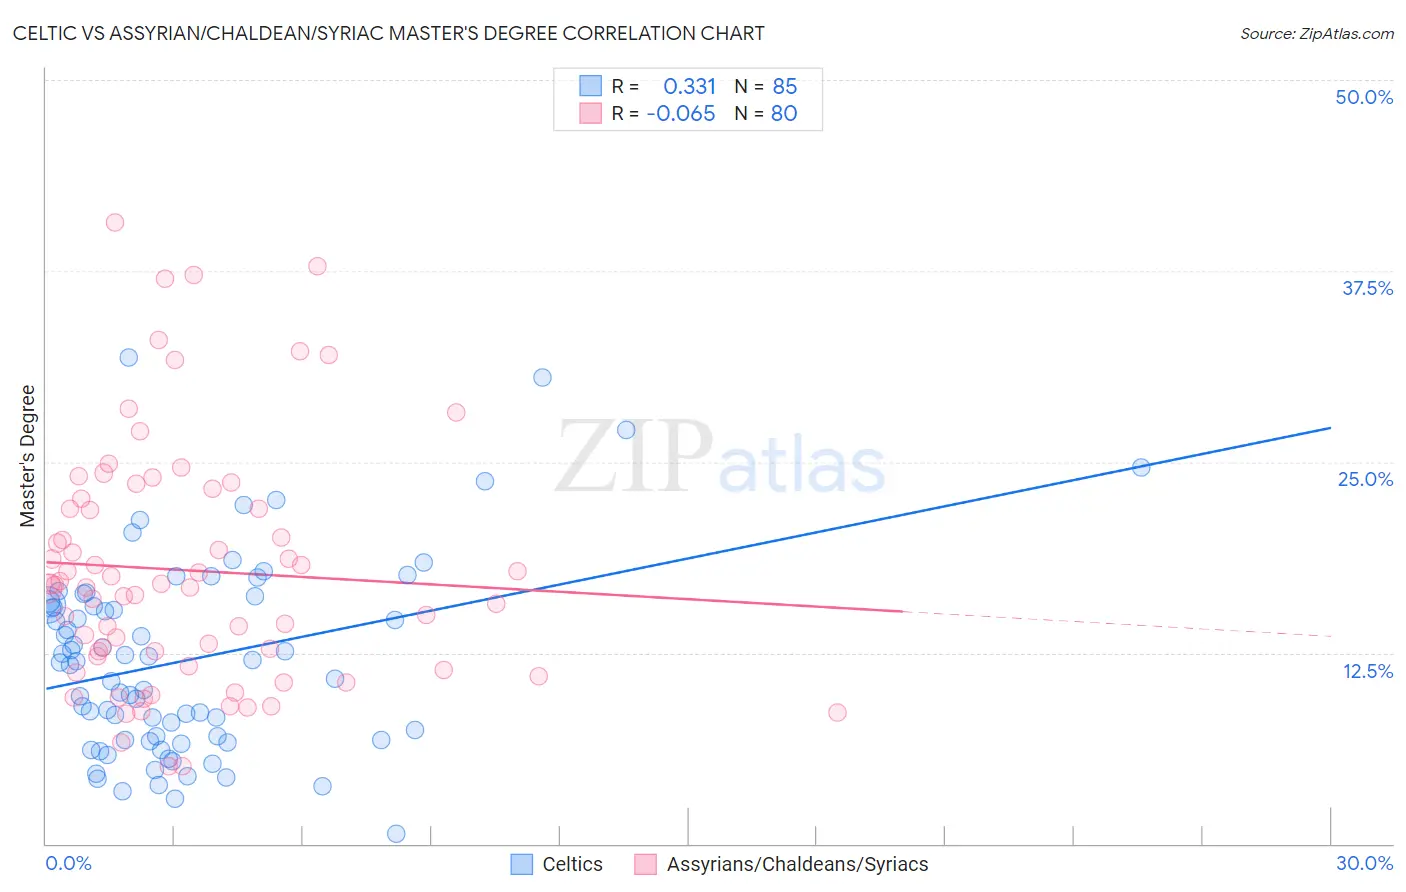
Celtic vs Assyrian/Chaldean/Syriac Master's Degree Correlation Chart
The statistical analysis conducted on geographies consisting of 168,868,569 people shows a mild positive correlation between the proportion of Celtics and percentage of population with at least master's degree education in the United States with a correlation coefficient (R) of 0.331 and weighted average of 14.8%. Similarly, the statistical analysis conducted on geographies consisting of 110,306,955 people shows a slight negative correlation between the proportion of Assyrians/Chaldeans/Syriacs and percentage of population with at least master's degree education in the United States with a correlation coefficient (R) of -0.065 and weighted average of 15.8%, a difference of 7.2%.
Master's Degree Correlation Summary
| Measurement | Celtic | Assyrian/Chaldean/Syriac |
| Minimum | 0.67% | 5.1% |
| Maximum | 31.9% | 40.6% |
| Range | 31.2% | 35.6% |
| Mean | 12.0% | 17.9% |
| Median | 11.9% | 16.9% |
| Interquartile 25% (IQ1) | 6.8% | 11.9% |
| Interquartile 75% (IQ3) | 15.7% | 22.3% |
| Interquartile Range (IQR) | 9.0% | 10.3% |
| Standard Deviation (Sample) | 6.4% | 8.0% |
| Standard Deviation (Population) | 6.3% | 7.9% |
Similar Demographics by Master's Degree
Demographics Similar to Celtics by Master's Degree
In terms of master's degree, the demographic groups most similar to Celtics are Immigrants from Iraq (14.8%, a difference of 0.010%), Swiss (14.7%, a difference of 0.020%), Czech (14.7%, a difference of 0.12%), Sri Lankan (14.7%, a difference of 0.22%), and Immigrants from Zaire (14.7%, a difference of 0.25%).
| Demographics | Rating | Rank | Master's Degree |
| Costa Ricans | 52.5 /100 | #173 | Average 15.0% |
| Slovaks | 50.0 /100 | #174 | Average 14.9% |
| Immigrants | Peru | 49.6 /100 | #175 | Average 14.9% |
| Nigerians | 48.6 /100 | #176 | Average 14.9% |
| Immigrants | Colombia | 48.3 /100 | #177 | Average 14.9% |
| English | 45.0 /100 | #178 | Average 14.8% |
| Immigrants | Iraq | 41.3 /100 | #179 | Average 14.8% |
| Celtics | 41.3 /100 | #180 | Average 14.8% |
| Swiss | 41.1 /100 | #181 | Average 14.7% |
| Czechs | 40.4 /100 | #182 | Average 14.7% |
| Sri Lankans | 39.6 /100 | #183 | Fair 14.7% |
| Immigrants | Zaire | 39.5 /100 | #184 | Fair 14.7% |
| Barbadians | 38.3 /100 | #185 | Fair 14.7% |
| Immigrants | Oceania | 37.1 /100 | #186 | Fair 14.7% |
| Basques | 36.5 /100 | #187 | Fair 14.7% |
Demographics Similar to Assyrians/Chaldeans/Syriacs by Master's Degree
In terms of master's degree, the demographic groups most similar to Assyrians/Chaldeans/Syriacs are European (15.8%, a difference of 0.10%), Pakistani (15.8%, a difference of 0.18%), Immigrants from Germany (15.8%, a difference of 0.24%), Vietnamese (15.8%, a difference of 0.33%), and Venezuelan (15.9%, a difference of 0.45%).
| Demographics | Rating | Rank | Master's Degree |
| Immigrants | Syria | 93.3 /100 | #129 | Exceptional 16.2% |
| Immigrants | Jordan | 92.7 /100 | #130 | Exceptional 16.1% |
| Taiwanese | 91.9 /100 | #131 | Exceptional 16.1% |
| Serbians | 91.7 /100 | #132 | Exceptional 16.1% |
| Immigrants | Sudan | 90.2 /100 | #133 | Exceptional 16.0% |
| Venezuelans | 88.4 /100 | #134 | Excellent 15.9% |
| South American Indians | 88.4 /100 | #135 | Excellent 15.9% |
| Assyrians/Chaldeans/Syriacs | 86.8 /100 | #136 | Excellent 15.8% |
| Europeans | 86.4 /100 | #137 | Excellent 15.8% |
| Pakistanis | 86.1 /100 | #138 | Excellent 15.8% |
| Immigrants | Germany | 85.9 /100 | #139 | Excellent 15.8% |
| Vietnamese | 85.5 /100 | #140 | Excellent 15.8% |
| Poles | 85.0 /100 | #141 | Excellent 15.7% |
| Immigrants | Africa | 84.0 /100 | #142 | Excellent 15.7% |
| Immigrants | Venezuela | 83.6 /100 | #143 | Excellent 15.7% |