Sri Lankan vs Immigrants from Hong Kong Nursery School
COMPARE
Sri Lankan
Immigrants from Hong Kong
Nursery School
Nursery School Comparison
Sri Lankans
Immigrants from Hong Kong
97.0%
NURSERY SCHOOL
0.0/ 100
METRIC RATING
312th/ 347
METRIC RANK
97.4%
NURSERY SCHOOL
0.0/ 100
METRIC RATING
287th/ 347
METRIC RANK
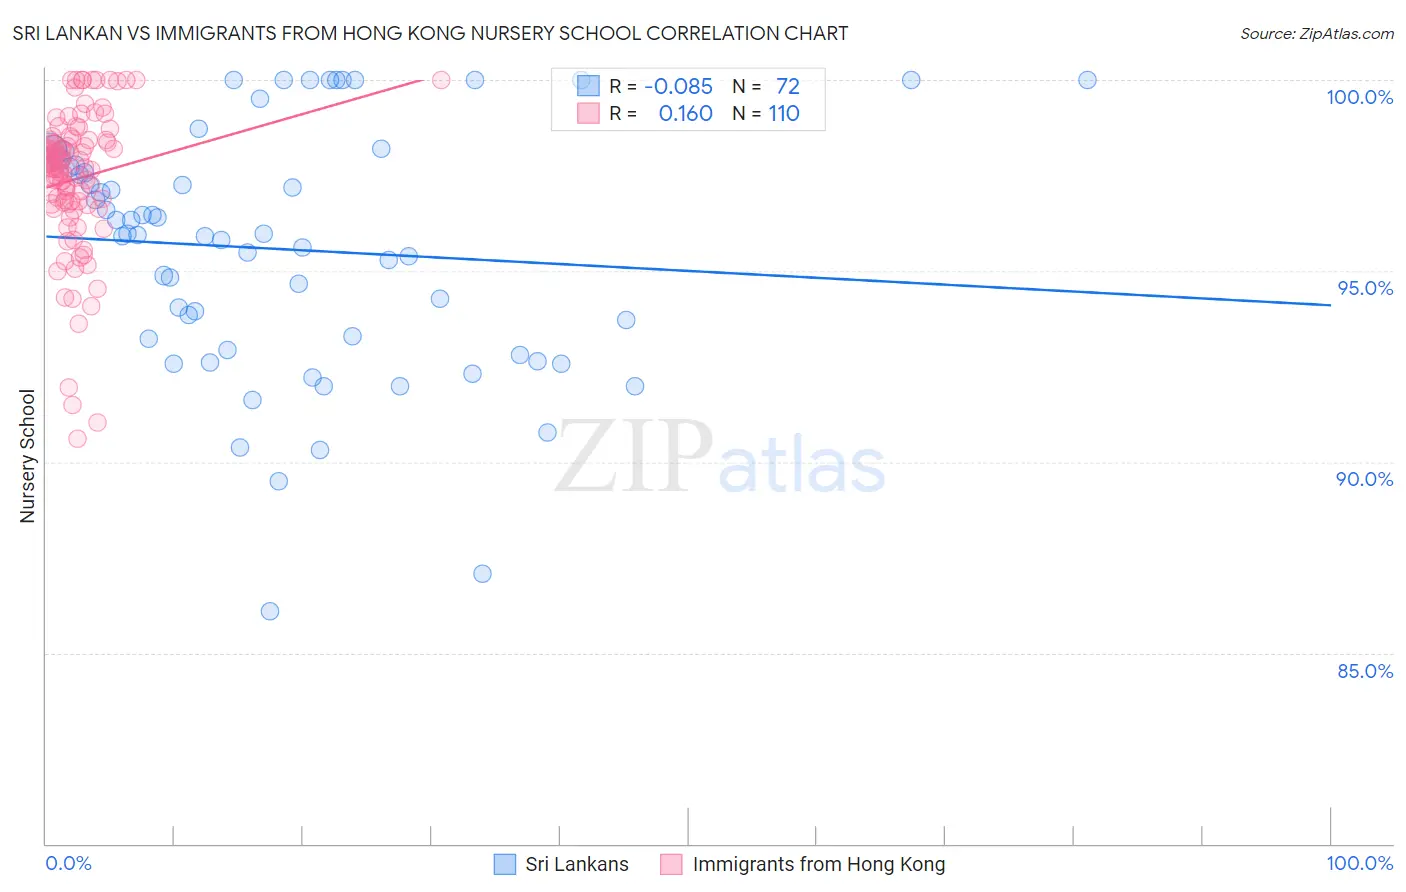
Sri Lankan vs Immigrants from Hong Kong Nursery School Correlation Chart
The statistical analysis conducted on geographies consisting of 440,593,746 people shows a slight negative correlation between the proportion of Sri Lankans and percentage of population with at least nursery school education in the United States with a correlation coefficient (R) of -0.085 and weighted average of 97.0%. Similarly, the statistical analysis conducted on geographies consisting of 253,948,669 people shows a poor positive correlation between the proportion of Immigrants from Hong Kong and percentage of population with at least nursery school education in the United States with a correlation coefficient (R) of 0.160 and weighted average of 97.4%, a difference of 0.38%.
Nursery School Correlation Summary
| Measurement | Sri Lankan | Immigrants from Hong Kong |
| Minimum | 86.1% | 90.6% |
| Maximum | 100.0% | 100.0% |
| Range | 13.9% | 9.4% |
| Mean | 95.6% | 97.4% |
| Median | 96.0% | 97.7% |
| Interquartile 25% (IQ1) | 93.1% | 96.8% |
| Interquartile 75% (IQ3) | 97.8% | 98.4% |
| Interquartile Range (IQR) | 4.8% | 1.7% |
| Standard Deviation (Sample) | 3.2% | 1.9% |
| Standard Deviation (Population) | 3.2% | 1.9% |
Similar Demographics by Nursery School
Demographics Similar to Sri Lankans by Nursery School
In terms of nursery school, the demographic groups most similar to Sri Lankans are Guyanese (97.0%, a difference of 0.0%), Immigrants from the Azores (97.0%, a difference of 0.0%), Immigrants from Somalia (97.0%, a difference of 0.010%), Honduran (97.0%, a difference of 0.020%), and Hispanic or Latino (97.0%, a difference of 0.030%).
| Demographics | Rating | Rank | Nursery School |
| Somalis | 0.0 /100 | #305 | Tragic 97.1% |
| Belizeans | 0.0 /100 | #306 | Tragic 97.0% |
| Hispanics or Latinos | 0.0 /100 | #307 | Tragic 97.0% |
| Immigrants | Haiti | 0.0 /100 | #308 | Tragic 97.0% |
| Immigrants | Somalia | 0.0 /100 | #309 | Tragic 97.0% |
| Guyanese | 0.0 /100 | #310 | Tragic 97.0% |
| Immigrants | Azores | 0.0 /100 | #311 | Tragic 97.0% |
| Sri Lankans | 0.0 /100 | #312 | Tragic 97.0% |
| Hondurans | 0.0 /100 | #313 | Tragic 97.0% |
| Cape Verdeans | 0.0 /100 | #314 | Tragic 97.0% |
| Immigrants | Nicaragua | 0.0 /100 | #315 | Tragic 96.9% |
| Immigrants | Belize | 0.0 /100 | #316 | Tragic 96.9% |
| Immigrants | Ecuador | 0.0 /100 | #317 | Tragic 96.9% |
| Immigrants | Guyana | 0.0 /100 | #318 | Tragic 96.9% |
| Immigrants | Laos | 0.0 /100 | #319 | Tragic 96.9% |
Demographics Similar to Immigrants from Hong Kong by Nursery School
In terms of nursery school, the demographic groups most similar to Immigrants from Hong Kong are Immigrants from Barbados (97.4%, a difference of 0.010%), Immigrants from Portugal (97.4%, a difference of 0.010%), Immigrants from Thailand (97.3%, a difference of 0.020%), Immigrants from West Indies (97.4%, a difference of 0.030%), and Immigrants from Trinidad and Tobago (97.4%, a difference of 0.030%).
| Demographics | Rating | Rank | Nursery School |
| Barbadians | 0.0 /100 | #280 | Tragic 97.4% |
| Trinidadians and Tobagonians | 0.0 /100 | #281 | Tragic 97.4% |
| Afghans | 0.0 /100 | #282 | Tragic 97.4% |
| Immigrants | West Indies | 0.0 /100 | #283 | Tragic 97.4% |
| Immigrants | Trinidad and Tobago | 0.0 /100 | #284 | Tragic 97.4% |
| Immigrants | Barbados | 0.0 /100 | #285 | Tragic 97.4% |
| Immigrants | Portugal | 0.0 /100 | #286 | Tragic 97.4% |
| Immigrants | Hong Kong | 0.0 /100 | #287 | Tragic 97.4% |
| Immigrants | Thailand | 0.0 /100 | #288 | Tragic 97.3% |
| Immigrants | St. Vincent and the Grenadines | 0.0 /100 | #289 | Tragic 97.3% |
| Immigrants | Afghanistan | 0.0 /100 | #290 | Tragic 97.3% |
| British West Indians | 0.0 /100 | #291 | Tragic 97.3% |
| Houma | 0.0 /100 | #292 | Tragic 97.3% |
| Malaysians | 0.0 /100 | #293 | Tragic 97.3% |
| Immigrants | Grenada | 0.0 /100 | #294 | Tragic 97.3% |