Celtic vs Immigrants from France 4th Grade
COMPARE
Celtic
Immigrants from France
4th Grade
4th Grade Comparison
Celtics
Immigrants from France
98.1%
4TH GRADE
99.8/ 100
METRIC RATING
51st/ 347
METRIC RANK
97.8%
4TH GRADE
94.8/ 100
METRIC RATING
120th/ 347
METRIC RANK
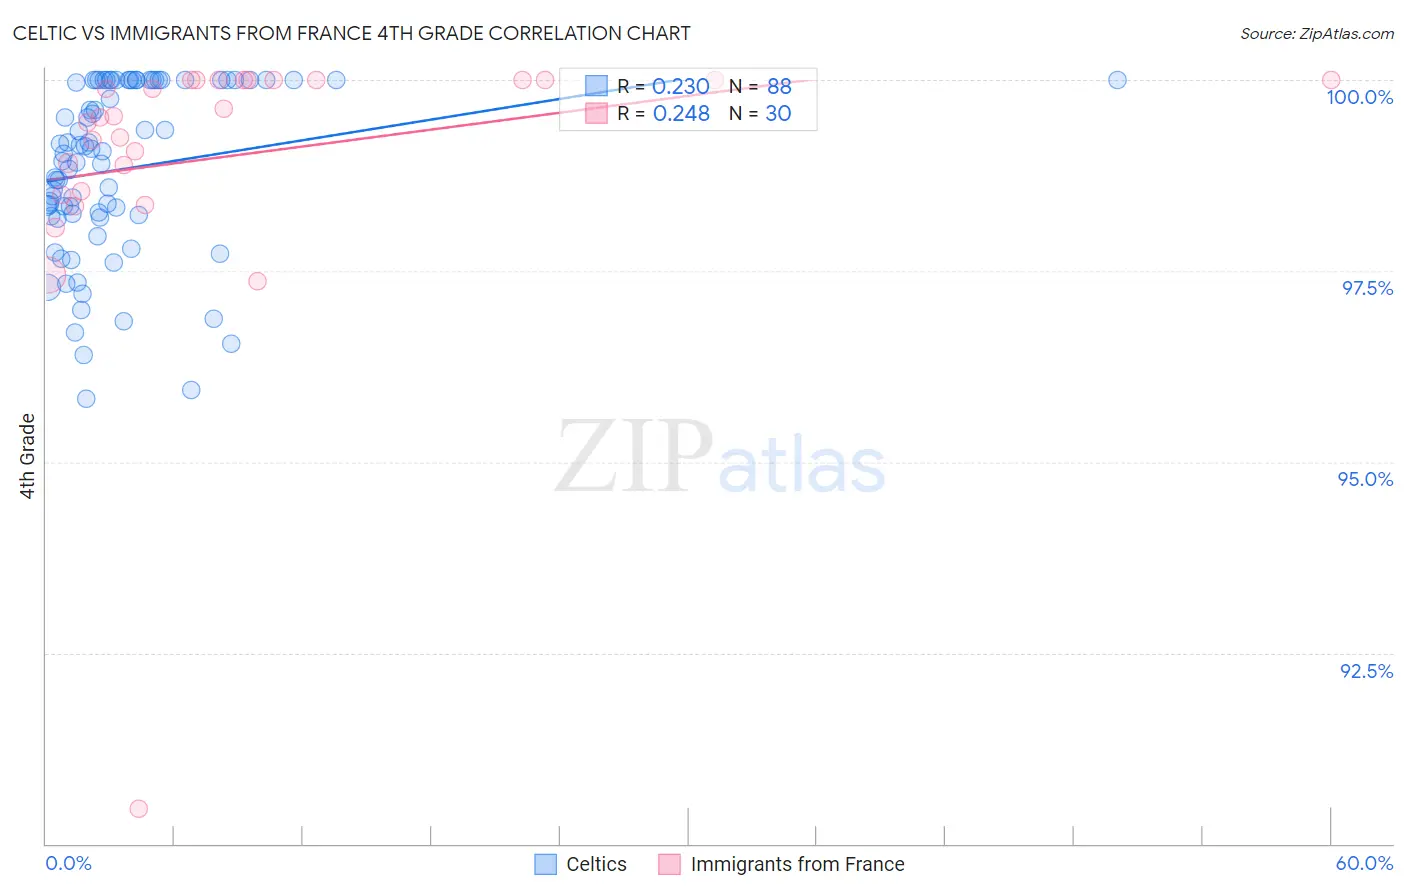
Celtic vs Immigrants from France 4th Grade Correlation Chart
The statistical analysis conducted on geographies consisting of 168,875,705 people shows a weak positive correlation between the proportion of Celtics and percentage of population with at least 4th grade education in the United States with a correlation coefficient (R) of 0.230 and weighted average of 98.1%. Similarly, the statistical analysis conducted on geographies consisting of 287,920,814 people shows a weak positive correlation between the proportion of Immigrants from France and percentage of population with at least 4th grade education in the United States with a correlation coefficient (R) of 0.248 and weighted average of 97.8%, a difference of 0.32%.
4th Grade Correlation Summary
| Measurement | Celtic | Immigrants from France |
| Minimum | 95.8% | 90.5% |
| Maximum | 100.0% | 100.0% |
| Range | 4.2% | 9.5% |
| Mean | 98.8% | 99.0% |
| Median | 99.1% | 99.5% |
| Interquartile 25% (IQ1) | 98.2% | 98.5% |
| Interquartile 75% (IQ3) | 100.0% | 100.0% |
| Interquartile Range (IQR) | 1.8% | 1.5% |
| Standard Deviation (Sample) | 1.1% | 1.8% |
| Standard Deviation (Population) | 1.1% | 1.8% |
Similar Demographics by 4th Grade
Demographics Similar to Celtics by 4th Grade
In terms of 4th grade, the demographic groups most similar to Celtics are Immigrants from Scotland (98.1%, a difference of 0.0%), Australian (98.1%, a difference of 0.0%), Estonian (98.1%, a difference of 0.010%), Bulgarian (98.1%, a difference of 0.010%), and Slavic (98.1%, a difference of 0.010%).
| Demographics | Rating | Rank | 4th Grade |
| Native Hawaiians | 99.9 /100 | #44 | Exceptional 98.1% |
| Czechoslovakians | 99.9 /100 | #45 | Exceptional 98.1% |
| Ottawa | 99.9 /100 | #46 | Exceptional 98.1% |
| Arapaho | 99.9 /100 | #47 | Exceptional 98.1% |
| Estonians | 99.8 /100 | #48 | Exceptional 98.1% |
| Bulgarians | 99.8 /100 | #49 | Exceptional 98.1% |
| Immigrants | Scotland | 99.8 /100 | #50 | Exceptional 98.1% |
| Celtics | 99.8 /100 | #51 | Exceptional 98.1% |
| Australians | 99.8 /100 | #52 | Exceptional 98.1% |
| Slavs | 99.8 /100 | #53 | Exceptional 98.1% |
| Maltese | 99.8 /100 | #54 | Exceptional 98.1% |
| Whites/Caucasians | 99.8 /100 | #55 | Exceptional 98.1% |
| Greeks | 99.8 /100 | #56 | Exceptional 98.1% |
| Austrians | 99.8 /100 | #57 | Exceptional 98.1% |
| Creek | 99.8 /100 | #58 | Exceptional 98.1% |
Demographics Similar to Immigrants from France by 4th Grade
In terms of 4th grade, the demographic groups most similar to Immigrants from France are Syrian (97.8%, a difference of 0.0%), Menominee (97.8%, a difference of 0.0%), Immigrants from Saudi Arabia (97.8%, a difference of 0.0%), Iroquois (97.8%, a difference of 0.010%), and Lebanese (97.8%, a difference of 0.010%).
| Demographics | Rating | Rank | 4th Grade |
| Basques | 95.8 /100 | #113 | Exceptional 97.8% |
| Iroquois | 95.4 /100 | #114 | Exceptional 97.8% |
| Lebanese | 95.4 /100 | #115 | Exceptional 97.8% |
| Immigrants | Croatia | 95.2 /100 | #116 | Exceptional 97.8% |
| Syrians | 94.9 /100 | #117 | Exceptional 97.8% |
| Menominee | 94.9 /100 | #118 | Exceptional 97.8% |
| Immigrants | Saudi Arabia | 94.8 /100 | #119 | Exceptional 97.8% |
| Immigrants | France | 94.8 /100 | #120 | Exceptional 97.8% |
| Immigrants | Norway | 94.2 /100 | #121 | Exceptional 97.8% |
| Immigrants | Japan | 94.1 /100 | #122 | Exceptional 97.8% |
| Immigrants | Zimbabwe | 93.9 /100 | #123 | Exceptional 97.8% |
| Spanish | 93.7 /100 | #124 | Exceptional 97.8% |
| Immigrants | Serbia | 92.6 /100 | #125 | Exceptional 97.8% |
| Immigrants | Europe | 92.5 /100 | #126 | Exceptional 97.8% |
| Colville | 92.3 /100 | #127 | Exceptional 97.7% |