Celtic vs American Unemployment Among Ages 45 to 54 years
COMPARE
Celtic
American
Unemployment Among Ages 45 to 54 years
Unemployment Among Ages 45 to 54 years Comparison
Celtics
Americans
4.4%
UNEMPLOYMENT AMONG AGES 45 TO 54 YEARS
86.2/ 100
METRIC RATING
130th/ 347
METRIC RANK
4.4%
UNEMPLOYMENT AMONG AGES 45 TO 54 YEARS
89.6/ 100
METRIC RATING
120th/ 347
METRIC RANK
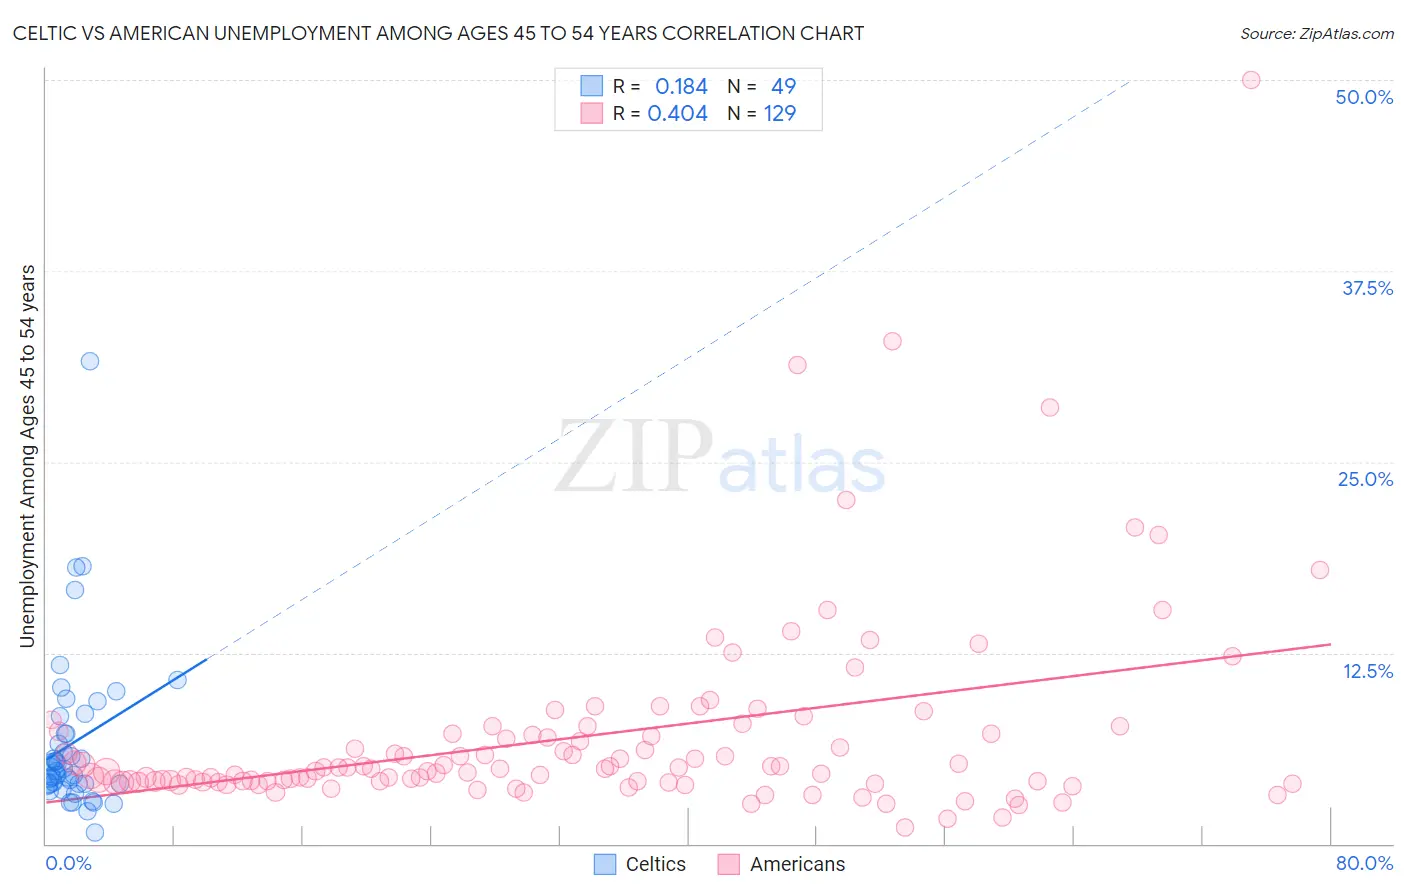
Celtic vs American Unemployment Among Ages 45 to 54 years Correlation Chart
The statistical analysis conducted on geographies consisting of 166,346,442 people shows a poor positive correlation between the proportion of Celtics and unemployment rate among population between the ages 45 and 54 in the United States with a correlation coefficient (R) of 0.184 and weighted average of 4.4%. Similarly, the statistical analysis conducted on geographies consisting of 535,200,927 people shows a moderate positive correlation between the proportion of Americans and unemployment rate among population between the ages 45 and 54 in the United States with a correlation coefficient (R) of 0.404 and weighted average of 4.4%, a difference of 0.39%.
Unemployment Among Ages 45 to 54 years Correlation Summary
| Measurement | Celtic | American |
| Minimum | 0.70% | 1.1% |
| Maximum | 31.6% | 50.0% |
| Range | 30.9% | 48.9% |
| Mean | 6.6% | 7.0% |
| Median | 4.7% | 4.9% |
| Interquartile 25% (IQ1) | 3.9% | 4.1% |
| Interquartile 75% (IQ3) | 7.8% | 7.2% |
| Interquartile Range (IQR) | 3.9% | 3.1% |
| Standard Deviation (Sample) | 5.3% | 6.5% |
| Standard Deviation (Population) | 5.2% | 6.5% |
Demographics Similar to Celtics and Americans by Unemployment Among Ages 45 to 54 years
In terms of unemployment among ages 45 to 54 years, the demographic groups most similar to Celtics are Laotian (4.4%, a difference of 0.020%), Immigrants from Germany (4.4%, a difference of 0.030%), Immigrants from Northern Europe (4.4%, a difference of 0.080%), Immigrants from Eastern Africa (4.4%, a difference of 0.11%), and Immigrants from Cameroon (4.4%, a difference of 0.13%). Similarly, the demographic groups most similar to Americans are Immigrants from Oceania (4.4%, a difference of 0.010%), Immigrants from Kazakhstan (4.4%, a difference of 0.010%), Native Hawaiian (4.4%, a difference of 0.050%), Immigrants from Romania (4.4%, a difference of 0.060%), and Immigrants from Asia (4.4%, a difference of 0.10%).
| Demographics | Rating | Rank | Unemployment Among Ages 45 to 54 years |
| Pakistanis | 90.7 /100 | #115 | Exceptional 4.4% |
| Immigrants | North Macedonia | 90.6 /100 | #116 | Exceptional 4.4% |
| South Africans | 90.4 /100 | #117 | Exceptional 4.4% |
| Immigrants | Romania | 90.0 /100 | #118 | Exceptional 4.4% |
| Native Hawaiians | 90.0 /100 | #119 | Excellent 4.4% |
| Americans | 89.6 /100 | #120 | Excellent 4.4% |
| Immigrants | Oceania | 89.5 /100 | #121 | Excellent 4.4% |
| Immigrants | Kazakhstan | 89.5 /100 | #122 | Excellent 4.4% |
| Immigrants | Asia | 88.8 /100 | #123 | Excellent 4.4% |
| Spanish | 88.8 /100 | #124 | Excellent 4.4% |
| Immigrants | Vietnam | 88.6 /100 | #125 | Excellent 4.4% |
| Immigrants | Czechoslovakia | 87.8 /100 | #126 | Excellent 4.4% |
| Nicaraguans | 87.6 /100 | #127 | Excellent 4.4% |
| Immigrants | Northern Europe | 86.9 /100 | #128 | Excellent 4.4% |
| Laotians | 86.3 /100 | #129 | Excellent 4.4% |
| Celtics | 86.2 /100 | #130 | Excellent 4.4% |
| Immigrants | Germany | 85.9 /100 | #131 | Excellent 4.4% |
| Immigrants | Eastern Africa | 85.1 /100 | #132 | Excellent 4.4% |
| Immigrants | Cameroon | 84.8 /100 | #133 | Excellent 4.4% |
| Afghans | 84.6 /100 | #134 | Excellent 4.4% |
| Immigrants | Eastern Asia | 84.0 /100 | #135 | Excellent 4.4% |